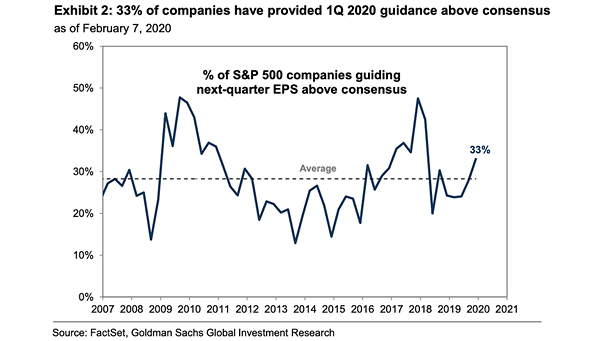
Earnings vs. Valuation

Earnings vs. Valuation Chart suggesting that changes in the P/E tend to mirror changes in earnings. Image: Fidelity Investments

U.S. Real GDP Leading Indicator

U.S. Real GDP Leading Indicator The U.S. real GDP leading indicator suggests an improvement in the second half of 2020 (R² = 0.74). Image: KKR Global Macro

U.S. National Housing Expansion Length

U.S. National Housing Expansion Length The current recovery in housing is in its 9th year. How long will it last? Image: John Burns Real Estate Consulting

S&P 500 Realized Volatility and U.S. Real GDP Growth

S&P 500 Realized Volatility and U.S. Real GDP Growth Chart suggesting the correlation between the S&P 500 realized volatility and U.S. real GDP growth. Image: Goldman Sachs Global Investment Research

U.S. AAII Sentiment Survey and S&P 500

U.S. AAII Sentiment Survey and S&P 500 This chart shows that market sentiment is important to contrarian investors. Image: Pictet Asset Management