Number of Months U.S. Economy in Recession
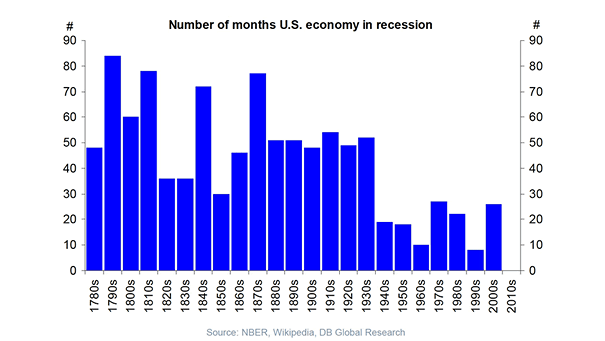
Number of Months U.S. Economy in Recession The 2010s are the first time a decade has gone without the U.S. falling into recession. Image: Deutsche Bank Global Research
Number of Months U.S. Economy in Recession The 2010s are the first time a decade has gone without the U.S. falling into recession. Image: Deutsche Bank Global Research
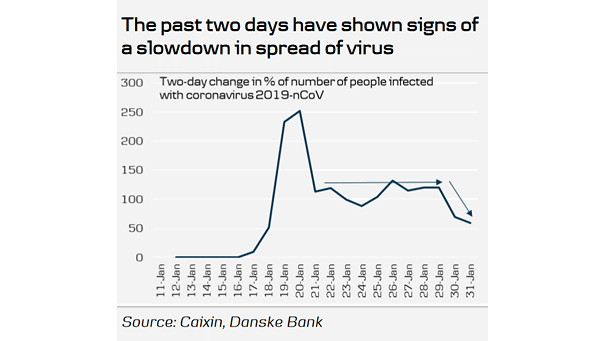
Number of People Infected with Coronavirus Uncertainty remains high, but the latest number of infections shows a slowdown in spread of coronavirus. Image: Danske Research
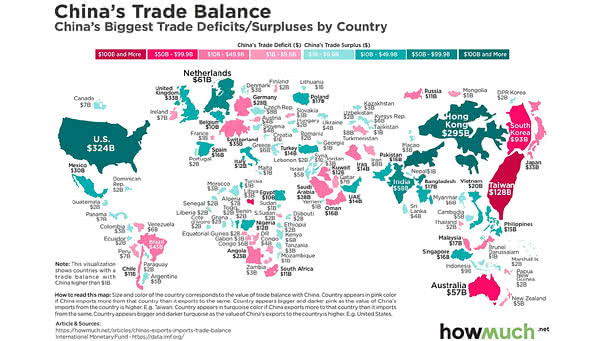
China’s Trade Balance by Country China exports $2.5 trillion worth of goods to other countries and has a trade balance of $367 billion. Image: howmuch.net
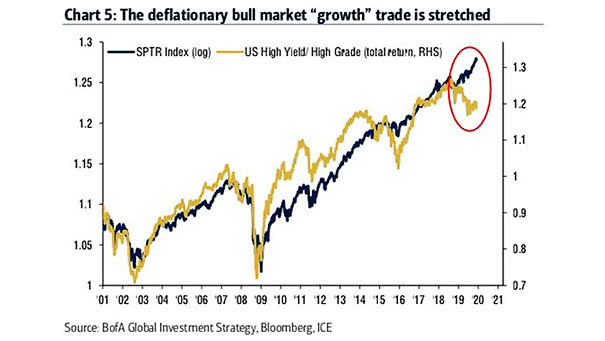
S&P 500 Total Return Index and U.S. High Yield/High Grade Chart suggesting a bullish market that is getting stretched and vulnerable. Image: BofA Global Investment Strategy
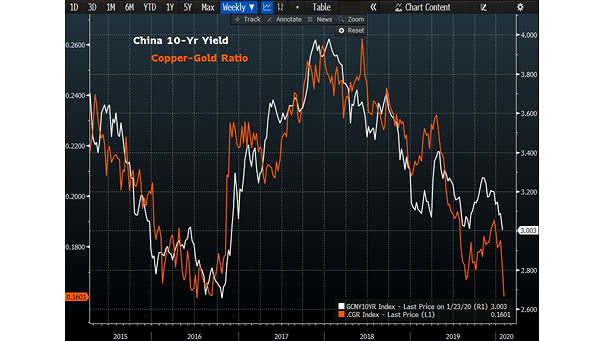
China 10-Year Yield and Copper to Gold Ratio Chart showing the weekly correlation between China 10-year yield and the copper to gold ratio (R² = 0.58). Image: Bloomberg
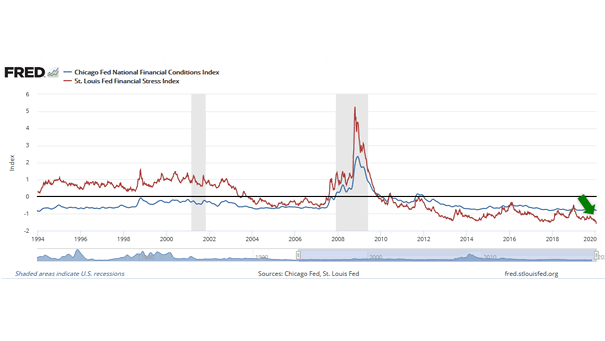
Financial Stress Index and Financial Conditions Index If financial conditions tighten sharply, this suggests a coming slowdown or recession. Currently, the St. Louis Financial Stress Index and the Chicago Fed National Financial Conditions Index are…
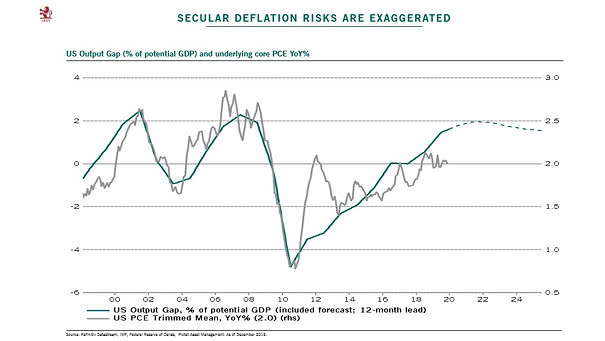
U.S. Output Gap (% of potential GDP) and Inflation U.S. output gap (% of potential GDP) tends to lead underlying core PCE by 12 months. Image: Pictet Asset Management
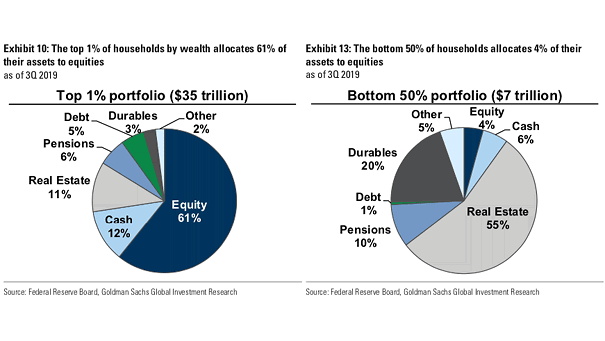
Inequality – Concentration of Equities Ownership by Wealth Class in the U.S. The top 1% of households owns equities, while the bottom 50% of households owns real estate. Image: Goldman Sachs Global Investment Research
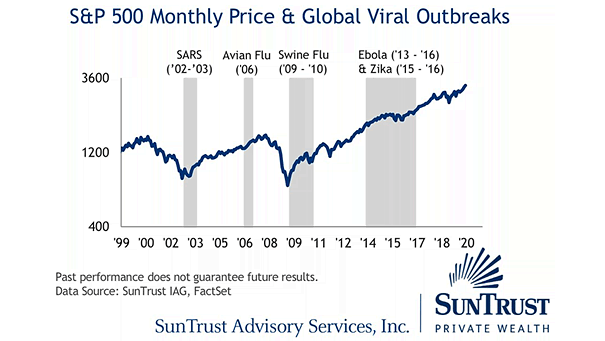
S&P 500 Performance and Global Viral Outbreaks This chart highlights the S&P performance through prior global viral outbreaks. Image: Truist
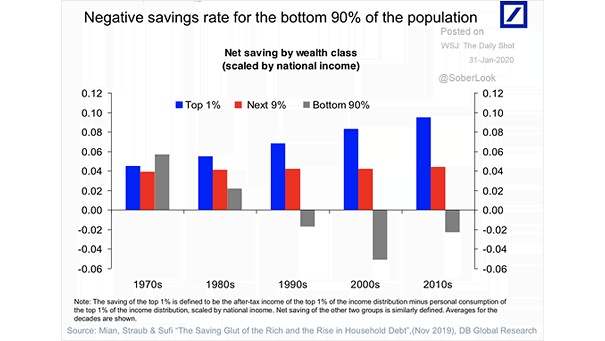
Inequality – Net Saving by Wealth Class in the U.S. This chart shows that the savings rate for the bottom 90% of the U.S. population is negative since the 1990s. Image: Deutsche Bank Global Research
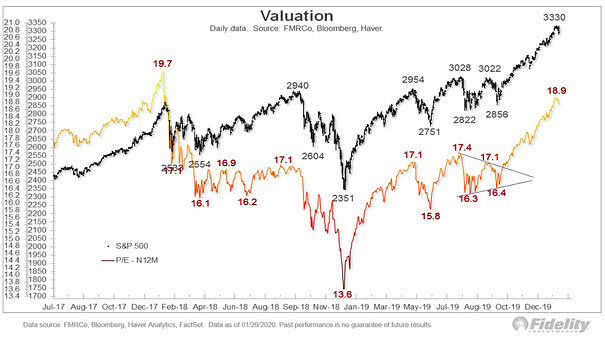
Valuation – S&P 500 Forward P/E Ratio Chart showing that the forward P/E ratio of the S&P 500 remains at high level, above its historical range. Image: Fidelity Investments