The SARS Analog – Virus Outbreaks and Global Markets
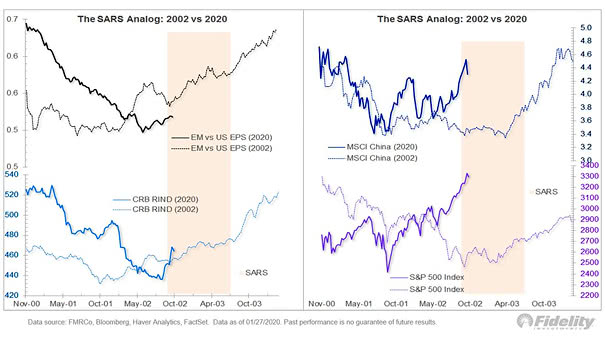
The SARS Analog – Virus Outbreaks and Global Markets The chart shows the SARS analog (2002 vs. 2020), highlighting the S&P 500 Index, the MSCI China Index, emerging markets vs. U.S. EPS and the CRB…