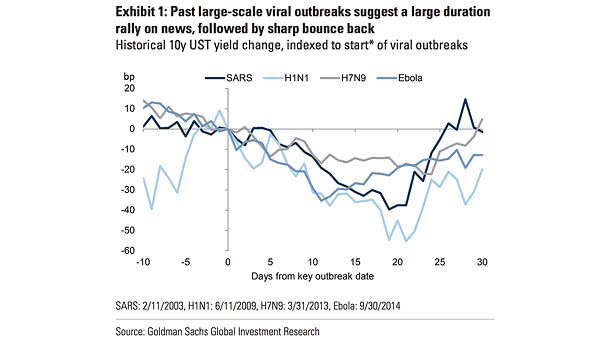
S&P 500 Valuation Metric

S&P 500 Valuation Metric Is the U.S. equity market overvalued? The S&P 500’s median valuation metric is in the 89th percentile. That’s not cheap by historical standards. Image: Goldman Sachs Global Investment Research

U.S. Jobless Claims and Recession

U.S. Jobless Claims and Recession Currently, U.S. jobless claims look good. This chart suggests that jobless claims tend to rise above the red line, prior to a recession.

Real Interest Rates and Recessions

U.S. Real Interest Rates and Recessions Currently, U.S. real interest rates are negative. In recent history, real interest rates were at least above 1.8% (orange line) before a recession.

Cumulative Weekly Fund Flows

Cumulative Weekly Fund Flows In terms of fund flows, this chart highlights the decade of fixed income. Image: BofA Global Research

World Trade and Copper

World Trade and Copper Chart suggesting that any improvement in world trade should benefit copper. Image: BofA Global Research