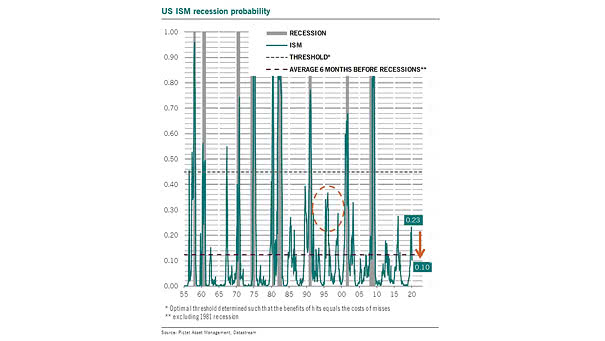
U.S. ISM Recession Probability
U.S. ISM Recession Probability Chart showing that historically, a level greater than 44.5% has indicated a recession. Current U.S. ISM levels suggest a recession probability of 10%. Image: Pictet Asset Management
U.S. ISM Recession Probability Chart showing that historically, a level greater than 44.5% has indicated a recession. Current U.S. ISM levels suggest a recession probability of 10%. Image: Pictet Asset Management
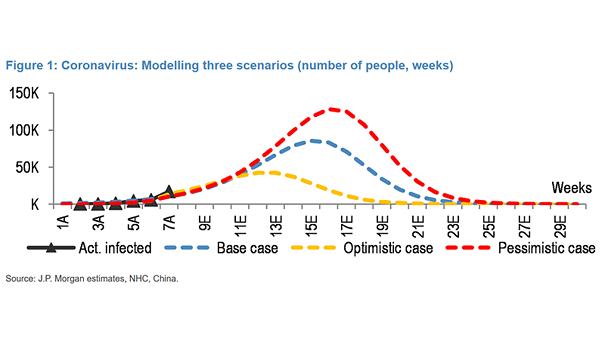
Coronavirus and Three Forecasts Optimistic case: peak of ~42k infections by the 2nd week of March Base case: peak of ~85k infections at the end of March Pessimistic case: peak of ~128k infections by the…
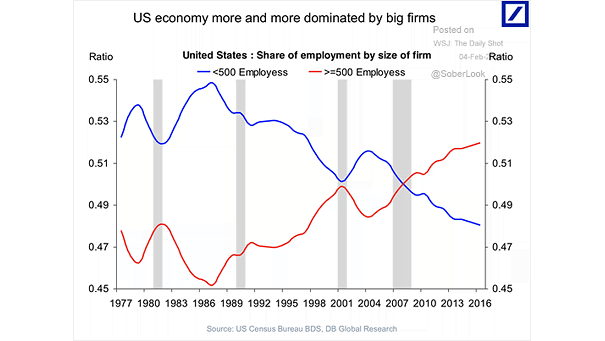
U.S. Big Companies and U.S. Job Market Big firms dominate the U.S. economy and the U.S. job market. Image: Deutsche Bank Global Research
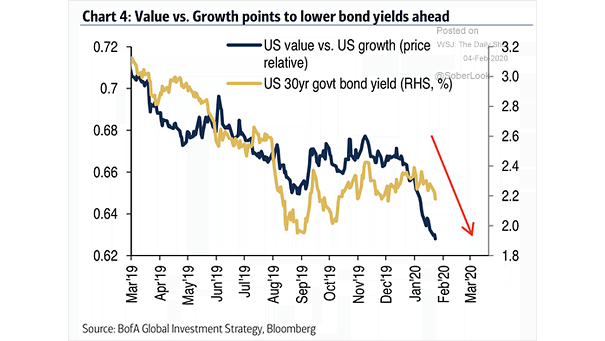
Value vs. Growth and U.S. 30-Year Government Bond Yield The outperformance of U.S. growth stocks relative to U.S. value stocks suggests lower bond yields ahead. Image: BofA Global Investment Strategy
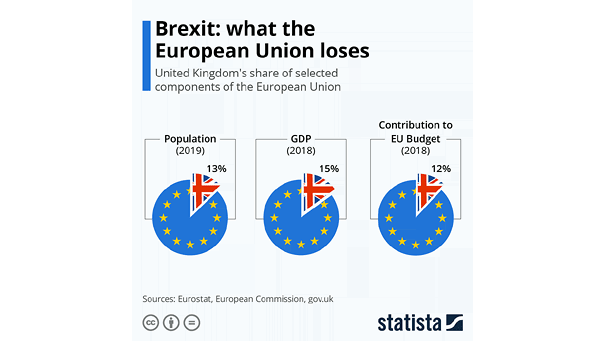
Brexit: What the European Union Loses? The chart puts into perspective what the European Union stands to lose when the Brexit transition is complete. Image: Statista
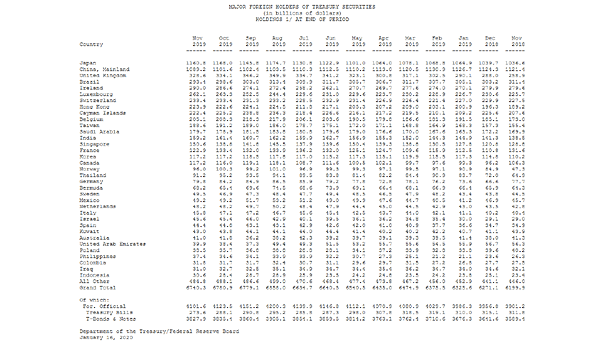
Treasury Holdings: Who Are the Major Foreign Holders of U.S. Treasury Securities? Currently, the two major foreign holders of U.S. Treasury securities are Japan and China. Japan surpasses China as largest foreign holder of U.S. Treasuries.…
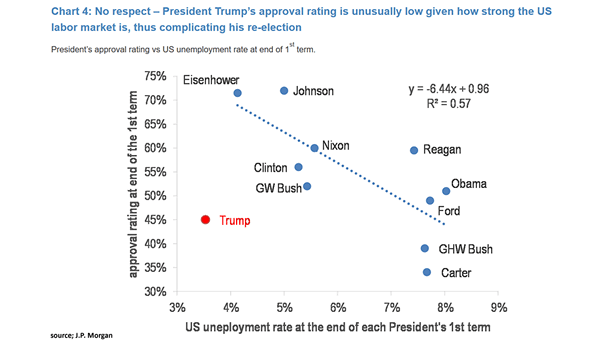
U.S. President’s Approval Rating vs. U.S. Unemployment Rate at End of First Term President Trump’s approval rating is historically low compared to the unemployment rate. Image: J.P. Morgan
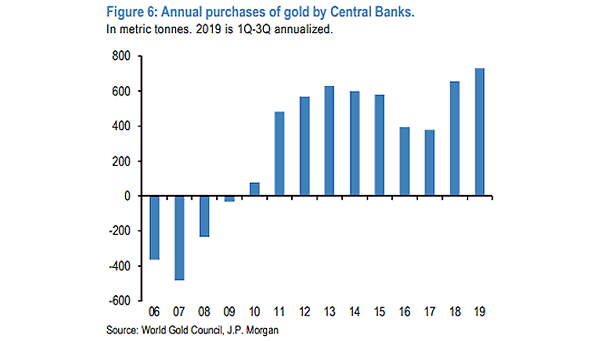
Annual Purchases of Gold by Central Banks The first three quarters of 2019 were the largest central banks purchase of gold in recent history, due to geopolitical tensions. Image: J.P. Morgan
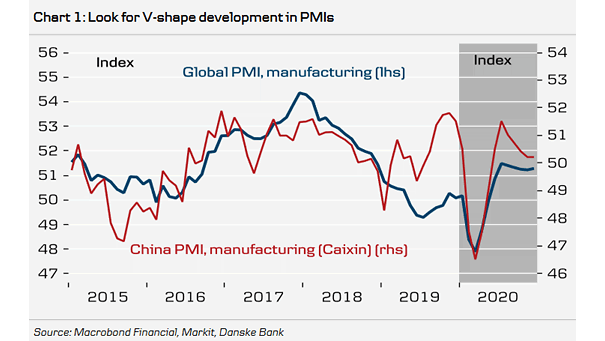
Global Manufacturing PMI and China Manufacturing PMI The chart suggests a sharp rebound of PMI in Q2 2020 on back of coronavirus. Image: Danske Research
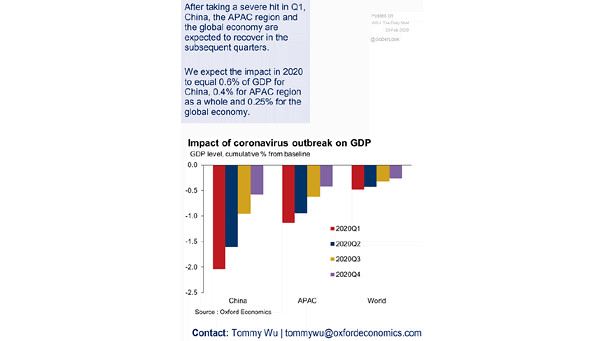
Impact of Coronavirus Outbreak on GDP The impact of the coronavirus outbreak on global GDP is estimated at 0.25% in 2020. Image: Oxford Economics