AAII Sentiment Survey
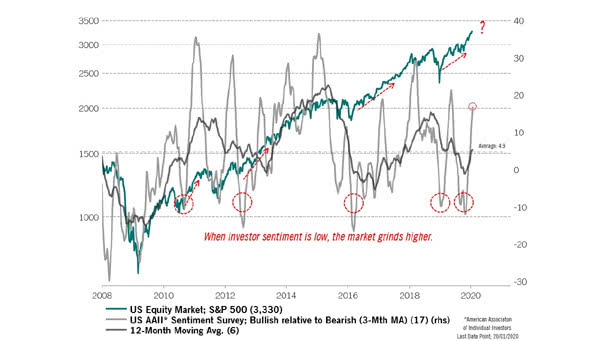
AAII Sentiment Survey Bearish sentiment among U.S. retail investors dipped just below the halfway mark at 49.8%, but remains well above the long-term average. This is not surprising, given the uneasy market mood. Image: The…
AAII Sentiment Survey Bearish sentiment among U.S. retail investors dipped just below the halfway mark at 49.8%, but remains well above the long-term average. This is not surprising, given the uneasy market mood. Image: The…
Hyperscalers Realized Year/Year Growth – Earnings vs. Free Cash Flow While hyperscalers are still delivering steady earnings, their free cash flow growth has sharply cooled, and that gap could prove costly, since stock performance has…
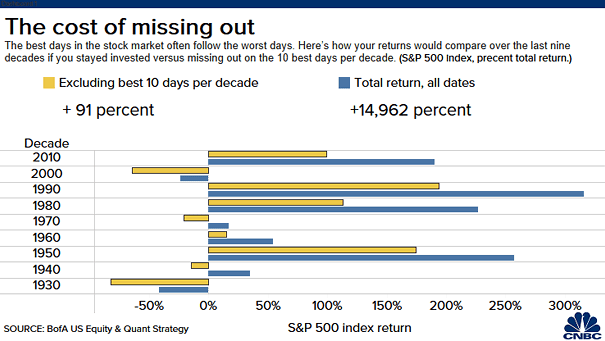
S&P 500 Index – Best and Worst Days For the S&P 500, the worst days and the best usually arrive together. Skip the best days and you may miss the rebounds, but avoiding the big…
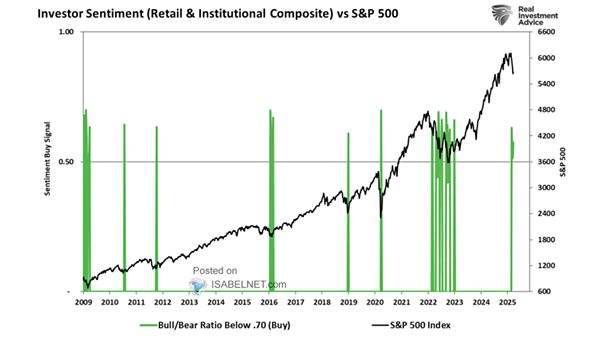
Investors Intelligence Bull-Bear Spread and S&P 500 Bulls are slipping out the side door again. Over the past decade, every net gain in the S&P 500 came when the II bull-bear spread was above 20%.…
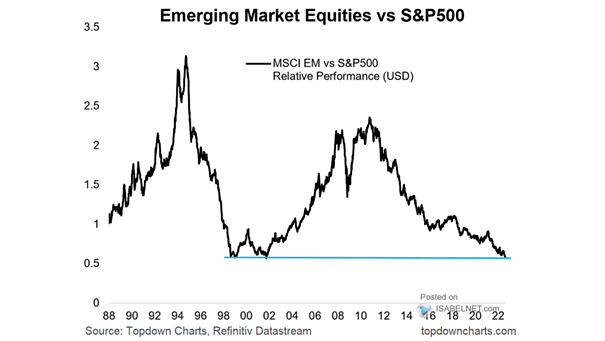
S&P 500 Performance vs. EM and DM Ex-U.S. Equities Since the Middle East conflict began, the S&P 500 has left global peers behind, outperforming both emerging and developed ex‑U.S. markets. Investors still see the U.S.…
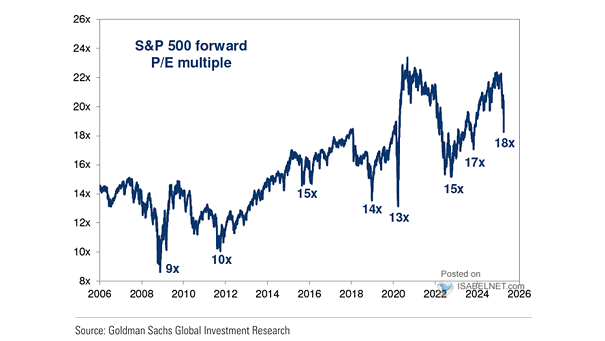
Valuation – S&P 500 Forward P/E Multiple Goldman Sachs’s top-down valuation model points to a 21x forward P/E for the S&P 500 at end-2026, a step down from 22x as oil volatility and macro headwinds…
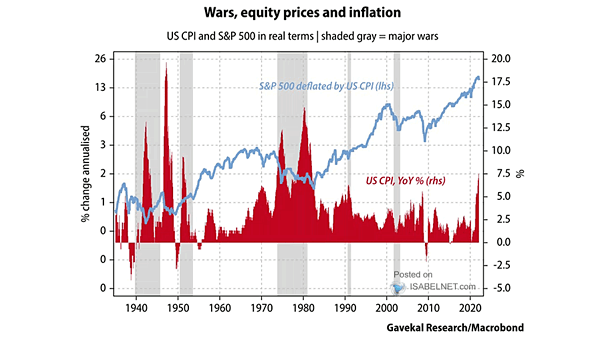
U.S. Equities and Wars Some major geopolitical events have knocked U.S. stocks down 15% or more before. Is this time different? For now, markets look like they’re pricing in hope, not fear. Image: Gavekal, Macrobond
S&P 500 Futures vs. Brent Crude Oil S&P 500 futures and Brent crude oil have moved in tandem lately, but the correlation has softened this week. Are markets breaking away from oil prices? Maybe investors…
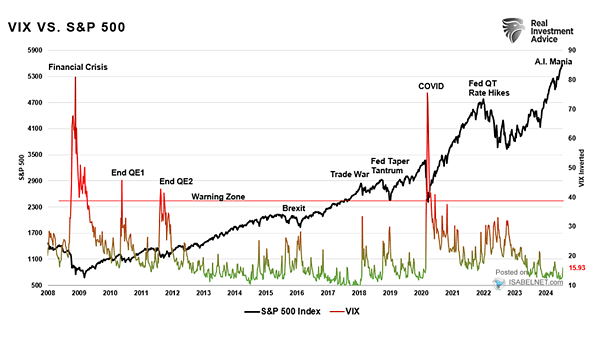
VIX vs. S&P 500 Compared with past oil shocks, the S&P 500’s drop looks measured. Investors seem braced for short-term turbulence rather than a structural shift in sentiment. The pullback feels more like caution than…
Fed Funds Rate vs. Gasoline Price / Core CPI When gasoline prices rise faster than inflation and move in step with growth, the Fed tends to lift rates. But what is the determining factor this…
Bloomberg Dollar Index One-Month Risk Reversals Currency markets are turning defensive, as demand for dollar upside and protection against violent swings gains pace amid Middle East tensions. Few things spook investors like uncertainty, and the…