S&P 500 Performance on the Week of FOMC Meetings
S&P 500 Performance on the Week of FOMC Meetings U.S. stocks have whipsawed through recent FOMC meetings, but the average week still closes in the green. Image: Deutsche Bank Asset Allocation
S&P 500 Performance on the Week of FOMC Meetings U.S. stocks have whipsawed through recent FOMC meetings, but the average week still closes in the green. Image: Deutsche Bank Asset Allocation
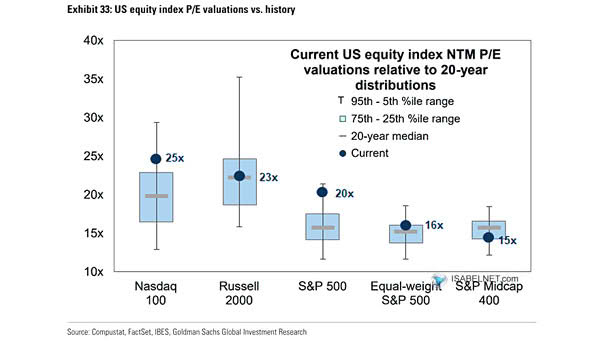
U.S. Equity Index P/E Valuations vs. History Risk appetite is firmly intact. The Russell 2000 trades at 24 times forward earnings, above the Nasdaq 100 at 23 times and the S&P 500 at 19 times.…
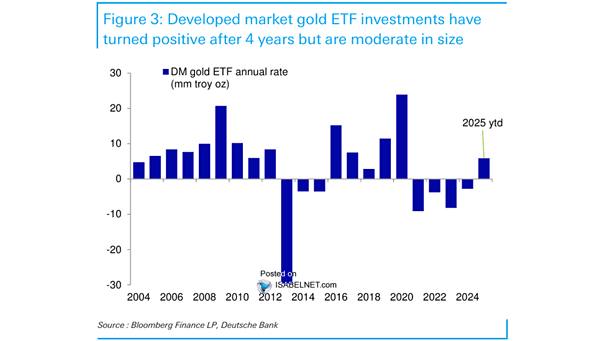
Forecast of Gold Prices Goldman Sachs still sees gold hitting $4,900 a troy ounce by the end of 2026, supported by relentless central-bank buying. But growing use of gold derivatives to hedge policy risk could…
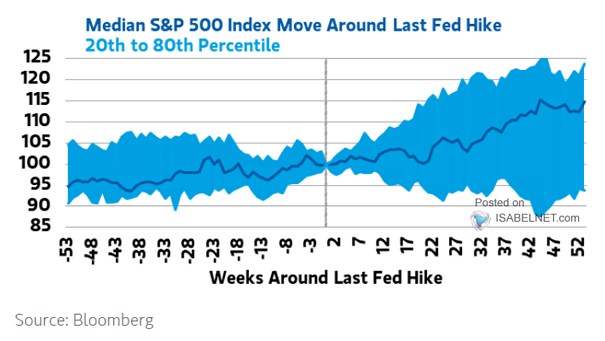
S&P 500 Return Around Start of Fed Hiking Cycles History says the S&P 500 tends to stumble in the weeks after the Fed starts hiking, before recovering as the broader trend resumes. Image: Goldman Sachs…
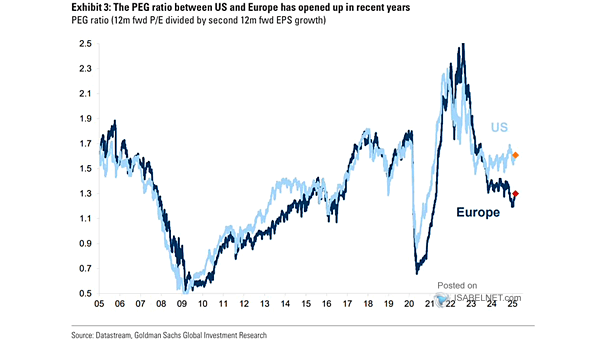
Valuation – S&P 500 PEG Ratio Fwd P/E? Rich. PEG? Cheap, because long-term earnings-growth estimates are the highest since 1995. That low PEG is just blockbuster growth expectation. A recession or an AI-spending slowdown could…
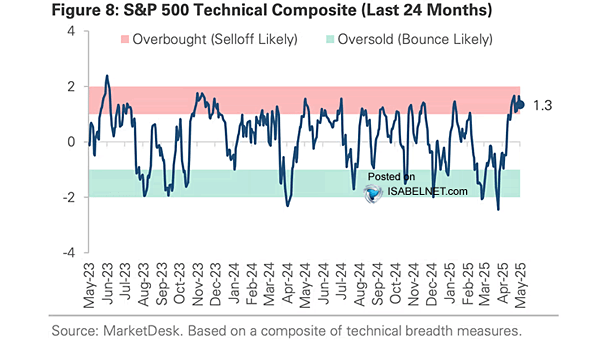
S&P 500 Technical Composite A composite of technical breadth measures is screaming oversold on the S&P 500, boosting the odds of a reflexive rally. Setups like this can flip quickly once buyers return. Image: MarketDesk…
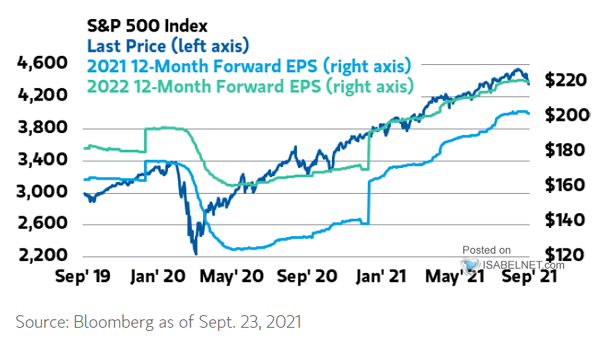
S&P 500 Forward P/E Ratio and Forward EPS Sustainable bull markets are driven by corporate earnings and fundamentals, not just hope. Vibes can lift prices for a while, but profits are what keep the rally…
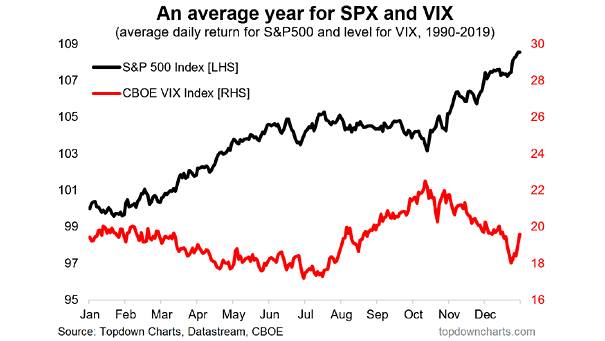
VIX and S&P 500 Seasonality The VIX and the S&P 500 usually move in opposite directions. As the VIX begins its seasonal rise from late July into autumn, the S&P 500’s path tends to get…
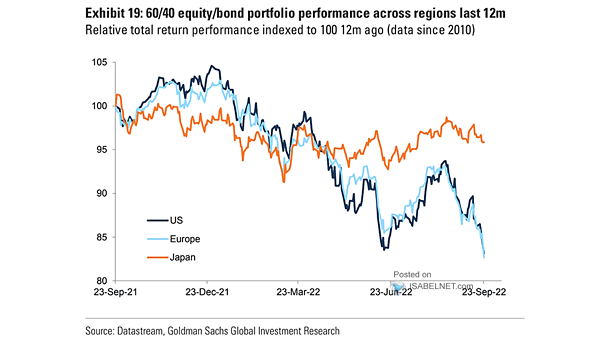
World Portfolio / Gold – 1-Month Rolling Correlation Gold diversifies global portfolios again, acting as insurance against currency depreciation, geopolitical risk, and inflation, and as a hedge when stocks and bonds don’t move together. Image:…
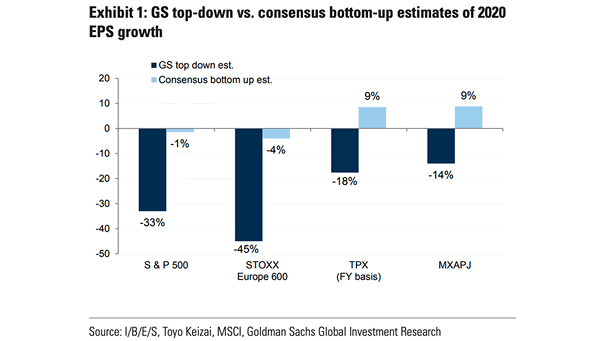
EPS – GS Top-Down vs. Consensus Bottom-Up Estimates Goldman Sachs is adopting a more cautious stance than the street, expecting S&P 500 EPS to rise 24% in 2026, reaching approximately $340. That is notably below…
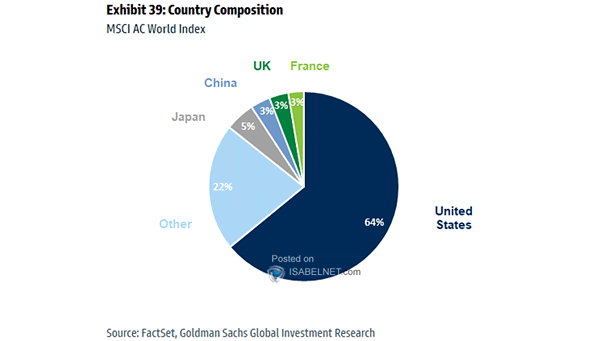
Share of Global Market Capitalization With just 4% of the world’s population, the United States commands 63% of global equity value. Foreign capital keeps flowing toward its innovation engine. When Wall Street moves, the world…