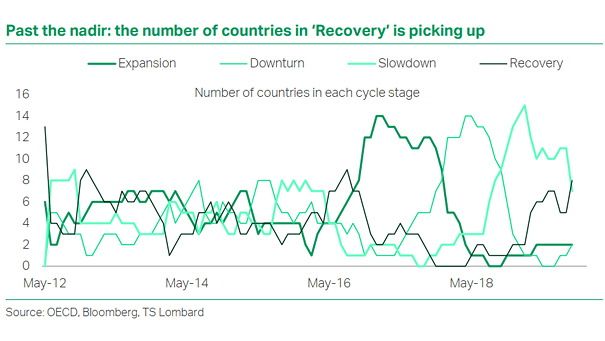
U.S. Equity Flows and S&P 500

U.S. Equity Flows Chart showing that money is once again flowing slightly into equity funds and ETFs. Image: Fidelity Investments

MSCI ACWI and Global Composite PMI

MSCI ACWI and Global Composite PMI Chart suggesting that global equities expect a pickup in global growth, as policy stimulus takes effect. Image: Morgan Stanley Research

Simple U.S. Risk Parity Strategy

Simple U.S. Risk Parity Strategy Risk parity strategies performed very well this year. Image: Goldman Sachs Global Investment Research

December Return vs. All Months Return

December Return vs. All Months Return Historically, the percentage of positive returns in December has been above average for stocks and bonds since 1990. Image: Goldman Sachs Global Investment Research

Market Cycle Back Tested over the Years

Market Cycle Back Tested over the Years Chart suggesting that the end of a bull market often occurs when the percentage signals that are bullish fall to 30% or below. Image: Richardson Wealth

2020 Forecasts for the S&P 500

2020 Forecasts for the S&P 500 Analysts are forecasting losses or moderate gains for the S&P 500 in 2020. Image: The Wall Street Journal