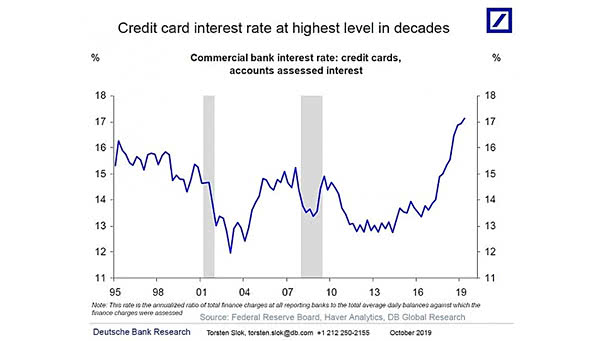
Commercial Bank – Credit Cards Interest Rate
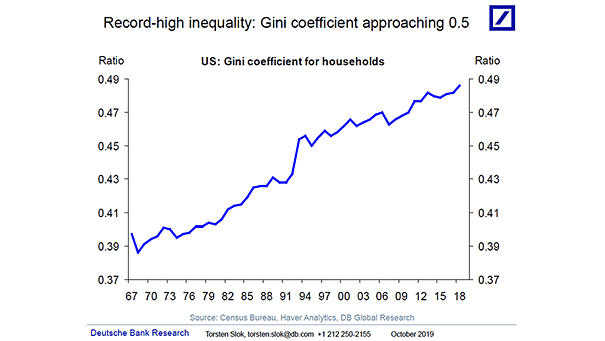
Commercial Bank – Credit Cards Interest Rate In the United States, the average credit card interest rate is 17.39%, at highest level in decades. Is the U.S. consumer doing well? Image: Deutsche Bank Global Research