Hard Data vs. Soft Data
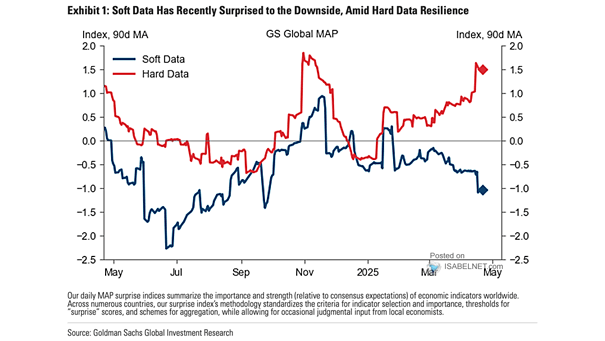
Hard Data vs. Soft Data The notable divergence between soft and hard economic data highlights the challenge of interpreting the true state of the economy. While sentiment surveys suggest caution, hard data has yet to…
Hard Data vs. Soft Data The notable divergence between soft and hard economic data highlights the challenge of interpreting the true state of the economy. While sentiment surveys suggest caution, hard data has yet to…

ISABELNET Cartoon of the Day With the S&P 500 jumping 4.59% last week, bulls are celebrating like they just hit the jackpot, while bears are trying to find their lost optimism! Have a Great Week,…
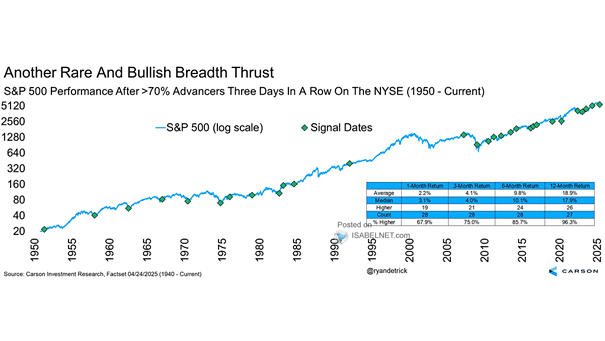
S&P 500 Performance After >70% Advancers Three Days in a Row on the NYSE Historically, three consecutive days with over 70% NYSE advancers signal strong bullish momentum. Since 1950, the S&P 500 has delivered positive…
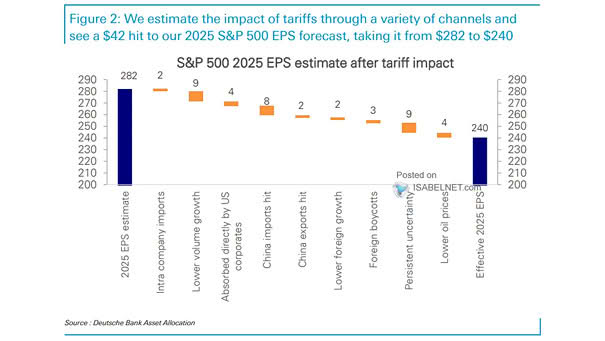
S&P 500 2025 EPS Estimate After Tariff Impact Deutsche Bank slashed its 2025 S&P 500 EPS estimate to $240 (from $282) due to tariffs’ outsized burden on U.S. companies. The S&P 500 index could rally…
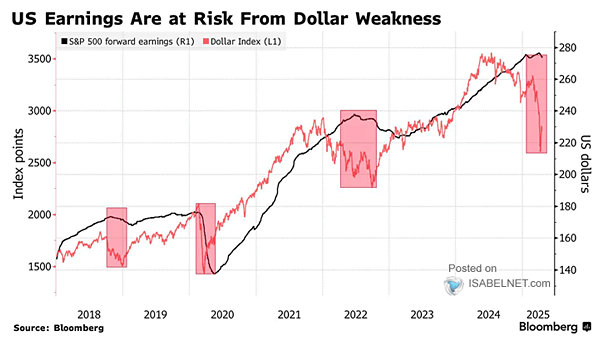
S&P 500 Forward Earnings and U.S. Dollar Index The weakening U.S. dollar is raising significant concerns for U.S. corporate earnings, particularly through its interplay with tariffs and global economic uncertainty. Image: Bloomberg
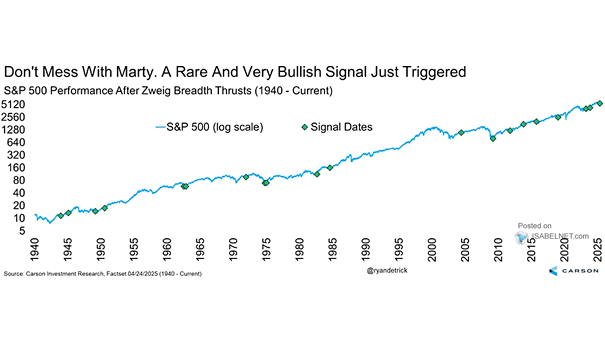
S&P 500 and Zweig Breadth Thrust Bulls have reason to smile as the Zweig Breadth Thrust has perfectly predicted S&P 500 gains in all 19 post-WWII instances, averaging 23.4% returns within a year and never…
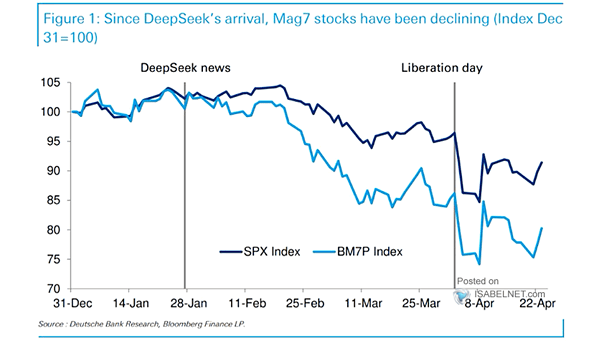
Magnificent Seven Stocks vs. S&P 500 Index Since DeepSeek’s emergence in January 2025, the Magnificent Seven stocks have underperformed compared to the S&P 500, driven by AI disruption fears and concerns over capital expenditures. Image:…

ISABELNET Cartoon of the Day While bulls are toasting the S&P 500 gains this week, bears are busy Googling “emergency exits from a market rally.” Happy Friday, Everyone! 😎
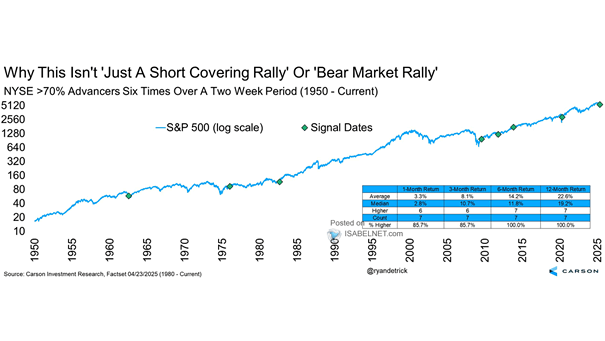
S&P 500 and NYSE >70% Advancers Six Times Over a Two Weeks Period Six trading days with NYSE advancers exceeding 70% within a two-week period historically signal a robust bullish phase—distinct from bear-market rallies—with an…
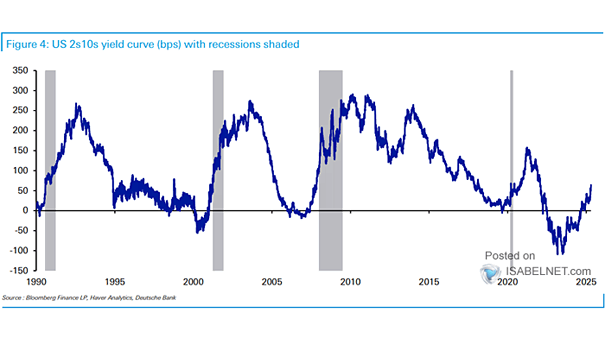
U.S. 10Y-2Y Yield Curve While a steepening inverted yield curve has historically warned of recession, persistent economic strength could mean a more positive outlook for U.S. equities in 2025—though this would mark a notable break…
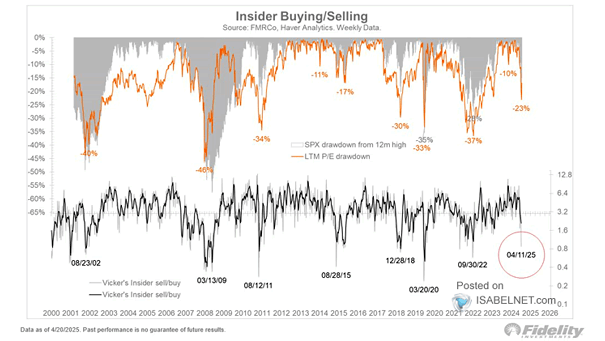
S&P 500 Drawdown and Insider Buying/Selling The Vickers insider sell/buy ratio, which tracks corporate insider transactions, indicates insiders perceive value at current price levels—a trend historically viewed as a bullish signal for market direction. Image:…