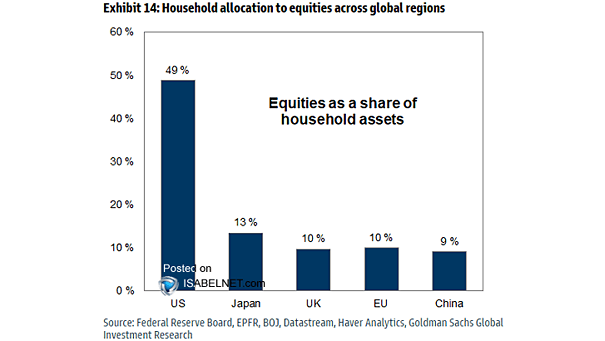
Average S&P 500 Performance During Corrections

Average S&P 500 Performance During Corrections In bear markets, sharp rallies are common but rarely signal a true bottom, as the primary downtrend tends to reassert itself afterward. Many investors believe the direction of U.S.…

Bear Market Rallies

Bear Market Rallies Since 1980, global bear market rallies have averaged 44 days with 14% gains. Prices have already rebounded 18% from the April 7 low. For a sustained recovery, a stronger economic outlook and…

S&P 500 Performance Recovering 50% of Bear Market

S&P 500 Performance Recovering 50% of Bear Market With the S&P 500 regaining half of its near-bear market losses in 2025, history strongly suggests that the lows may already be behind us. Since 1950, the…

ISABELNET Cartoon of the Day

ISABELNET Cartoon of the Day After the S&P 500’s 2.92% rise last week, bulls are ready to party, but bears insist it’s too soon to celebrate-a bear market rally might crash the party! Have a…

Median S&P 500 Performance During 10% Corrections

Median S&P 500 Performance During 10% Corrections If there is no recession, U.S. stocks tend to do well after market corrections, often rebounding strongly and offering attractive returns to investors who stay the course. Image:…

S&P 500 8-Day Rolling % Returns

S&P 500 8-Day Rolling % Returns Rolling 8-day returns for the S&P 500, combined with technical and sentiment indicators, suggest the index is likely to enter a period of consolidation in the near term. Image:…

ISABELNET Cartoon of the Day

ISABELNET Cartoon of the Day With the S&P 500 up 2.92% this week, bulls are confident the market’s momentum will continue, while bears argue it’s just a bear market rally! Have a Great Weekend, Everyone!…

Trade Policy Uncertainty

Trade Policy Uncertainty When trade policy uncertainty peaks, the S&P 500 often posts positive returns. Markets tend to over-discount risks during uncertain periods, and relief rallies are common once worst-case scenarios are avoided or resolved.…