
ISABELNET Cartoon of the Day
ISABELNET Cartoon of the Day President Trump’s policies are “Making Volatility Great Again,” as bulls navigate turbulent markets while bears rejoice! Have a Great Day, Everyone! 😎
ISABELNET Cartoon of the Day President Trump’s policies are “Making Volatility Great Again,” as bulls navigate turbulent markets while bears rejoice! Have a Great Day, Everyone! 😎
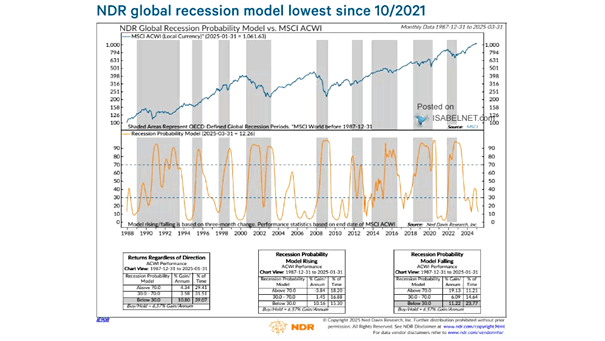
Global Recession Probability Model vs. MSCI ACWI NDR’s Global Recession Probability Model is at its lowest level in nearly four years, signaling a positive outlook for global equities. Image: Ned Davis Research
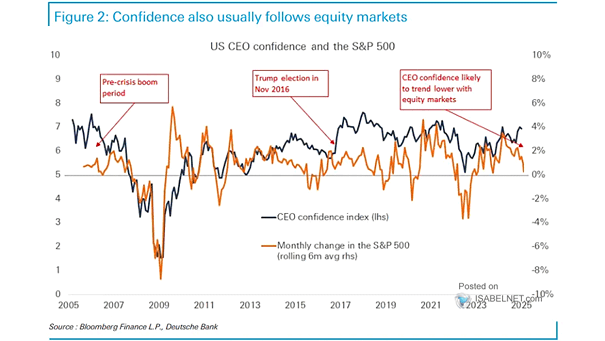
Conference Board CEO Confidence CEO optimism is closely tied to equity market performance, with market declines often precipitating a drop in executive confidence. Image: Deutsche Bank
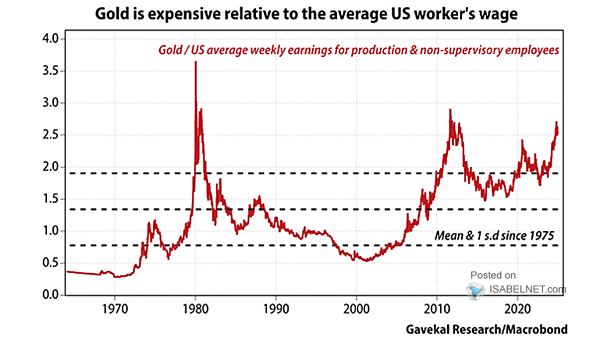
Gold / U.S. Average Worker’s Wage Despite a bullish outlook fueled by declining interest rates and ongoing central bank purchases, gold is seen as expensive relative to the average wage of a U.S. worker. Image: Gavekal, Macrobond

ISABELNET Cartoon of the Day Wall Street bears are convinced the bull market is just a mirage, while bulls are blissfully ignoring any mention of risk, claiming they have a temporary, but highly enjoyable, case of selective hearing! Happy “Hump” Day, Everyone! 🐫🐪😎
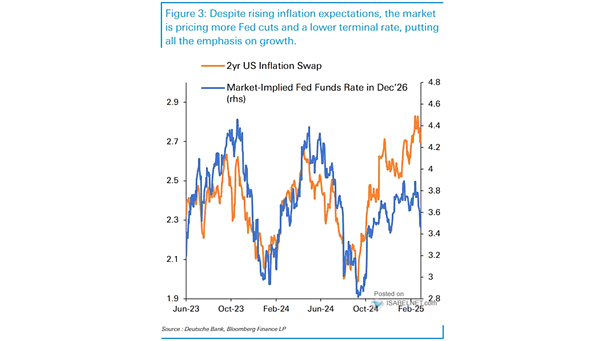
Market-Implied Fed Funds Rate and 2-Year U.S. Inflation Swap Current market pricing of Fed rate cuts indicates a pivot from inflation worries to growth concerns, suggesting investors expect the Fed to prioritize economic stability over aggressive inflation control. Image: Deutsche Bank
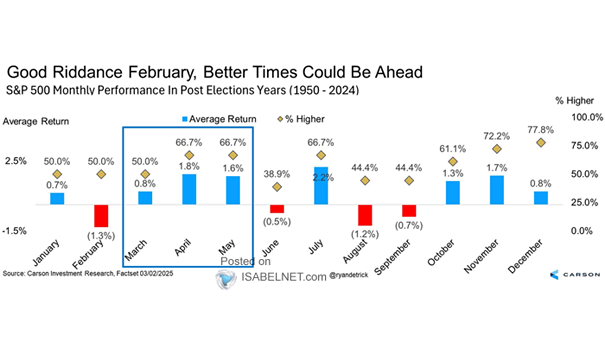
Seasonality – S&P 500 Index Performance Post-Election Years Since 1950, the U.S. stock market has historically shown strong performance in March, April, and May during post-election years, offering bulls reasons for optimism. Image: Carson Investment Research

ISABELNET Cartoon of the Day In the epic showdown of bull vs. bear, the wisest move might just be to sit back, relax, and master “The Art of No Deal”—because sometimes the best trade is no trade at all! Have a Great Day, Everyone! 😎
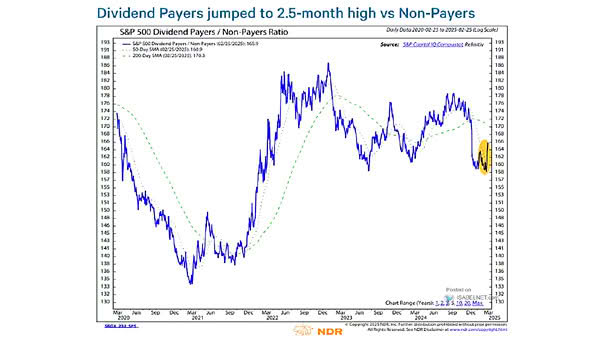
S&P 500 Dividend Payers / Non-Payers Ratio Amidst 2025’s market volatility, dividend stocks emerge as a compelling investment, offering both steady income and growth potential while serving as a robust tool for portfolio diversification. Image: Ned Davis Research
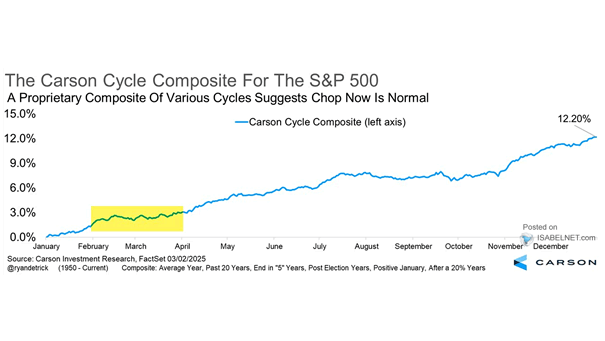
Cycle Composite for the S&P 500 While the market may face some choppiness in the near term, the Carson Cycle Composite’s prediction of a strong 2025 for U.S. stocks gives bulls reason for confidence. Image: Carson Investment Research
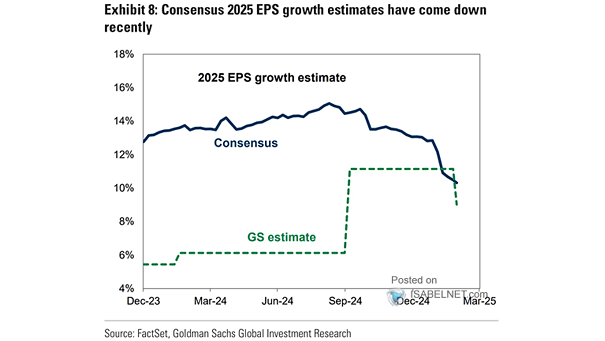
EPS Growth Estimate Despite a downward revision, consensus 2025 EPS growth estimates still project strong earnings growth. Image: Goldman Sachs Global Investment Research