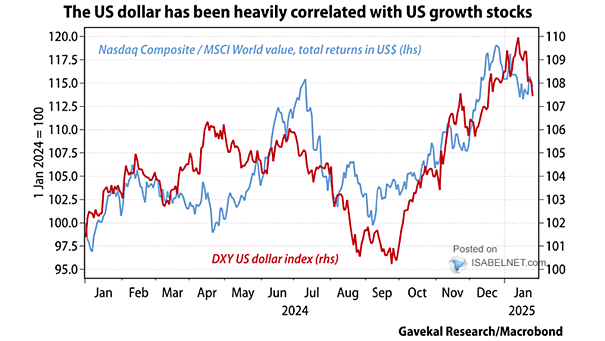
DXY U.S. Dollar Index vs. Nasdaq Composite / MSCI World Value
DXY U.S. Dollar Index vs. Nasdaq Composite / MSCI World Value Over the past two years, U.S. growth stocks—known for their sensitivity to currency fluctuations—have exhibited a strong correlation with the U.S. dollar. Image: Gavekal, Macrobond