Weekly U.S. Equity Fund Flows

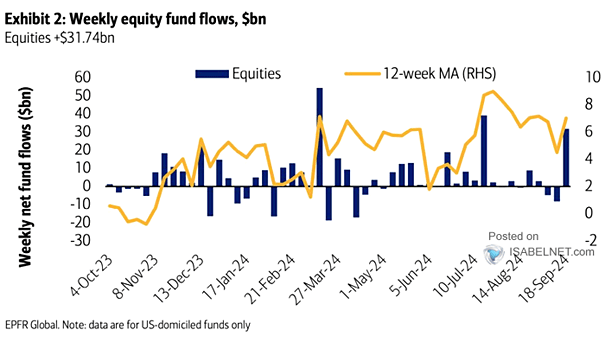
Weekly U.S. Equity Fund Flows U.S. equity funds have seen substantial inflows amounting to $31.74 billion, reflecting a strong positive sentiment among investors, particularly following the Fed’s decision to cut interest rates last week. Image: BofA Global Research

Fed Rate Cuts

Fed Rate Cuts Goldman Sachs forecasts a series of 25bp interest rate cuts through mid-2025, aimed at supporting economic growth amid fluctuating inflation rates. Image: Goldman Sachs Global Investment Research

S&P 500 TTM YoY EPS vs. Fed Funds Target

S&P 500 TTM YoY EPS vs. Fed Funds Target Traditionally, when the Fed starts cutting interest rates, corporate profits tend to decelerate. However, this’s not the case today, highlighting the unique economic landscape we face. Image: BofA US Equity & Quant Strategy

U.S. vs. Developed Market Equities (ex-US) Price Relative

U.S. vs. Developed Market Equities (ex-US) Price Relative While there is potential for U.S. equities to maintain their lead in the near term due to strong earnings and market dynamics, historical cycles suggest that this dominance may wane as international markets recover and valuations adjust. Image: BofA Global Investment Strategy

U.S. Fed Funds Target Rate

U.S. Fed Funds Target Rate While “panic rate cuts” have historically been associated with negative market outcomes, the current context suggests that Wall Street may be embracing these cuts as necessary adjustments rather than signs of economic distress. Image: BofA Global Investment Strategy

Factor Performance Prior and After the First Fed Rate Cut

Factor Performance Prior and After the First Fed Rate Cut Historically, the first rate cuts by the Federal Reserve during easing cycles have tended to favor Growth over Value, Small over Large, and Bonds over Stocks. Image: BofA US Equity & Quant Strategy

U.S. 10Y-2Y Yield Curve and Recessions

U.S. 10Y-2Y Yield Curve and Recessions When a recession is avoided, an un-inversion in the 2s10s U.S. Treasury yield curve may suggest a favorable outlook for U.S. stocks. Image: Goldman Sachs Global Investment Research

What Do You Think Is Currently the Most Crowded Trade?

What Do You Think Is Currently the Most Crowded Trade? For FMS investors, the “Long Magnificent Seven” trade continues to be the most crowded, largely attributed to the impressive performance and market leadership of these tech stocks. Image: BofA Global Fund Manager Survey

Median Index Returns Following First Fed Rate Cut

Median Index Returns Following First Fed Rate Cut Historically, midcaps have outperformed the S&P 500 and the Russell 2000 in the three and twelve months following the initial Federal Reserve rate cut. Image: Goldman Sachs Global Investment Research