Global Equities Flows
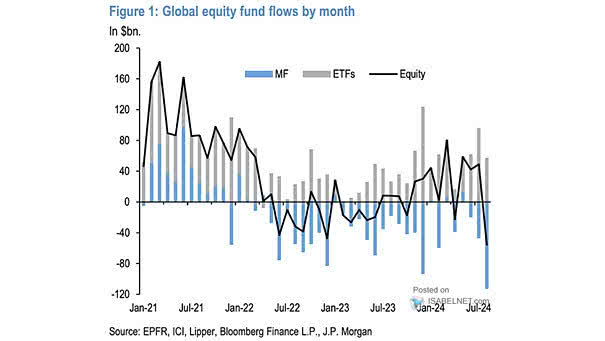
Global Equities Flows In August, global equity funds saw significant outflows, the largest since 2022, reflecting a cautious sentiment among investors. Image: J.P. Morgan
Global Equities Flows In August, global equity funds saw significant outflows, the largest since 2022, reflecting a cautious sentiment among investors. Image: J.P. Morgan
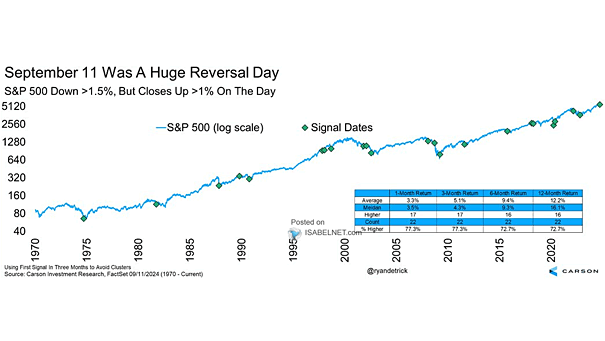
S&P 500 Down >1.5%, But Closes Up >1% on the Day Big reversal days, such as yesterday, have typically shown bullish trends in the U.S. stock market over the next 12 months, with a median gain of 16.1% since 1970. Image: Carson Investment Research
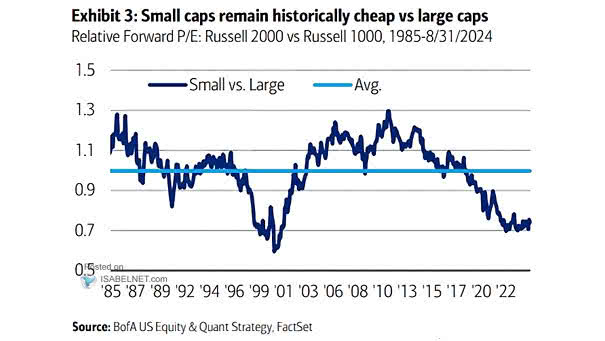
Valuation – Relative Forward P/E: Russell 2000 vs. Russell 1000 Small-caps may be an attractive option for long-term investors looking to diversify their investment portfolios, as they offer relatively cheaper valuations compared to large-caps. Image: BofA US Equity & Quant Strategy
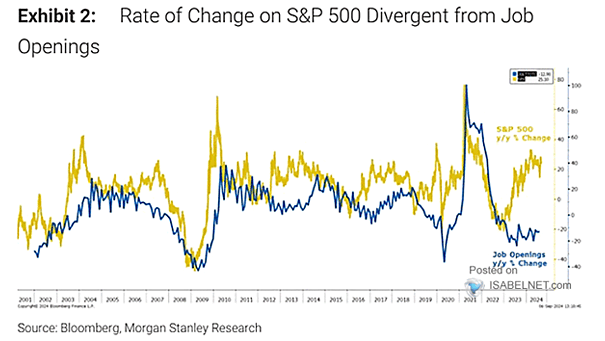
U.S. Job Openings and S&P 500 While job openings provide a snapshot of current economic conditions, the stock market reflects investor sentiment and expectations about the future. Image: BofA Global Investment Strategy
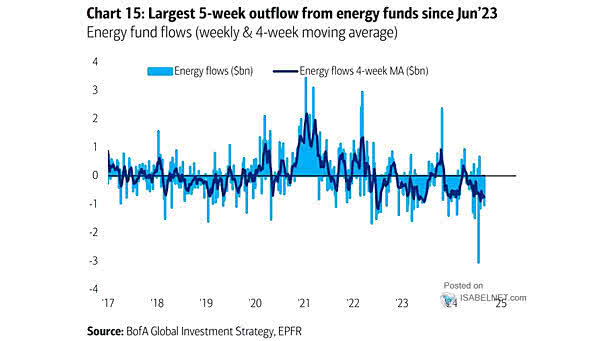
Weekly Energy Flows Energy funds are facing substantial outflows, driven by investor concerns over growth and policy uncertainties. Image: BofA Global Investment Strategy
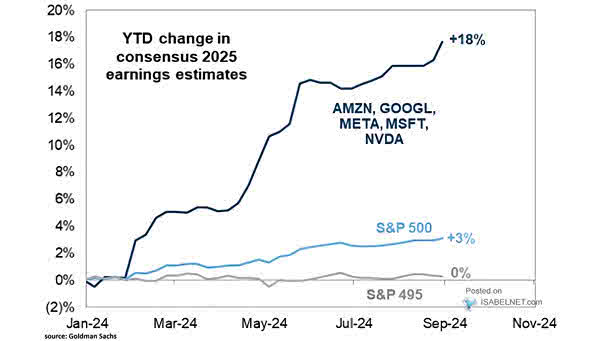
S&P 500 Earnings Estimates The Magnificent Five are positioned for strong earnings growth through 2025, driven by superior sales growth, robust profit margins, and reasonable valuations relative to their growth potential. Image: Goldman Sachs Global Investment Research

S&P 500 Days Sales of Inventory The trough of the inventory de-stocking cycle often coincides with the beginning of a broader business recovery, characterized by rising demand, improved economic conditions, and increased production and sales. Image: BofA Global Research
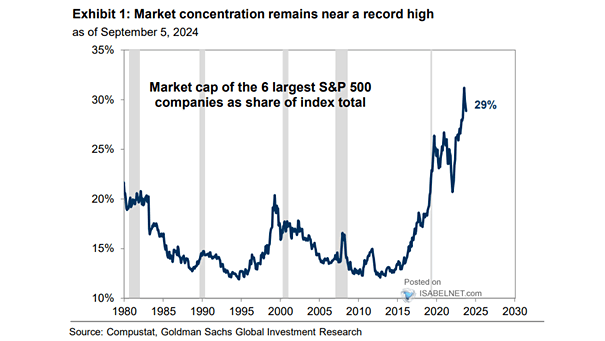
Market Capitalization of Six Largest Companies as Share of S&P 500 Total With the six largest companies accounting for 29% of the S&P 500’s total market capitalization, discussions about diversification have become increasingly relevant. A well-diversified portfolio is vital for effective risk management. Image: Goldman Sachs Global Investment Research
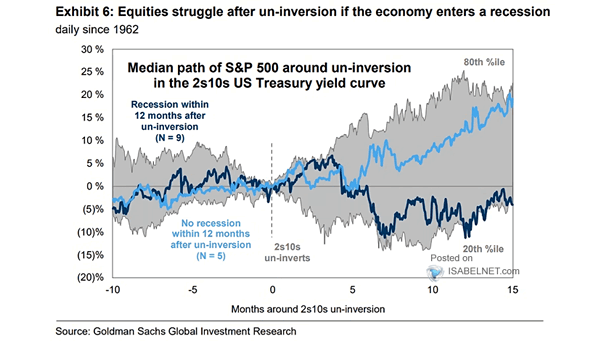
Median Path of S&P 500 Around Un-Inversion in the 2s10s U.S. Treasury Yield Curve An un-inversion in the 2s10s U.S. Treasury yield curve can suggest a positive outlook for U.S. stocks, if a recession is avoided. Image: Goldman Sachs Global Investment Research
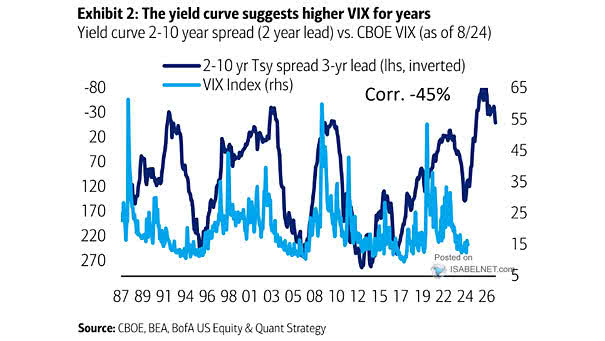
Yield Curve vs. VIX (Leading Indicator) Should U.S. equity investors anticipate increased volatility ahead, given that the yield curve typically leads the VIX by three years? Image: BofA US Equity & Quant Strategy
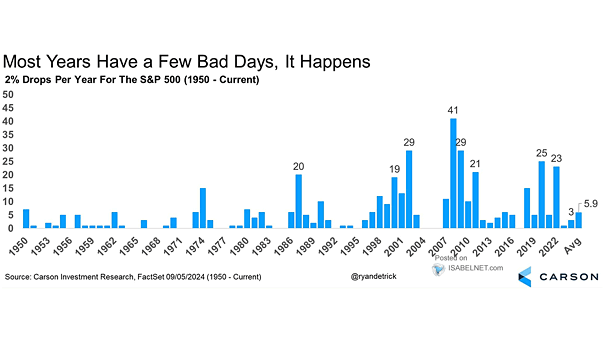
Number of 2% Drops per Year for the S&P 500 Index Though they can be uncomfortable, big drops in the U.S. stock market are relatively common, even in the best years. On average, the S&P 500 sees more than five drops of 2% or more each year. Image: Carson Investment Research