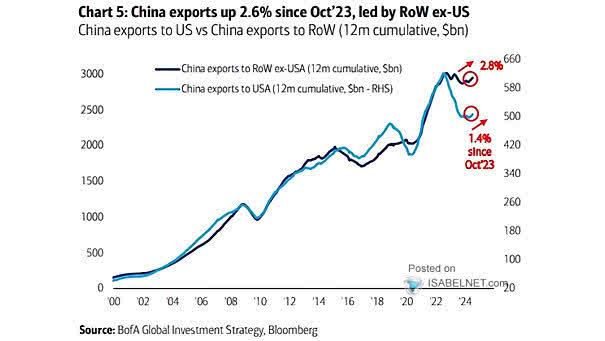
ISM Manufacturing PMI and U.S. Recessions

ISM Manufacturing PMI and U.S. Recessions A drop in the U.S. ISM Manufacturing PMI below 45 signals significantly heightened recession risks, indicating a severe contraction in the manufacturing sector. Image: BofA Global Research

VIX Average Trend in U.S. Election Years

VIX Average Trend in U.S. Election Years Historical patterns suggest that the VIX tends to bottom out in mid to late August, followed by a trend of increasing volatility as the U.S. Election Day approaches, driven by heightened market uncertainty. Image: BofA Global Research

U.S. Household Liquid Assets

U.S. Household Liquid Assets The amount of cash held by households in the United States has surged to an unprecedented level of $18 trillion, representing a significant increase from previous years. Image: BofA Research Investment Committee

Flows into Global Equity Funds

Flows into Global Equity Funds Flows into global equity funds have accelerated in recent weeks, reflecting a growing appetite for riskier investments. Image: Goldman Sachs Global Investment Research

Seasonality – Average Annualized S&P 500 Price Return by Month

Seasonality – Average Annualized S&P 500 Price Return by Month BofA’s strategists are cautioning investors about the potential for significant market corrections in the near term, driven by weak seasonal patterns and the uncertainties surrounding the U.S. election. Image: BofA US Equity & Quant Strategy

Gold vs. Japanese Yen

Gold vs. Japanese Yen Over the past two weeks, gold prices have declined by approximately 8% relative to the Japanese Yen. Image: BofA Global Investment Strategy

U.S. Firms Responses to Whether They Use AI to Produce Goods and Services

U.S. Firms Responses to Whether They Use AI to Produce Goods and Services Currently, only 5% of U.S. firms use AI to produce goods and services, but this figure is expected to grow as more companies recognize the potential benefits of AI technologies. Image: BofA US Equity & Quant Strategy

1-Day Post-Reporting Performance vs. S&P 500 on EPS and Sales Surprise

1-Day Post-Reporting Performance vs. S&P 500 on EPS and Sales Surprise Companies that exceeded both sales and EPS expectations outperformed the S&P 500 by 2.4ppt the following day, which is the strongest performance since 4Q2018 and considerably higher than the historical average of 1.5ppt. Image: BofA US Equity & Quant Strategy

Percentage of S&P 500 Earnings by Sector

Percentage of S&P 500 Earnings by Sector This week is a crucial one for S&P 500 earnings, with several key events and releases that could significantly impact the market. Image: BofA US Equity & Quant Strategy

S&P 500 Seasonality Since 1928

S&P 500 Seasonality Since 1928 The seasonal trends observed since 1928 indicate a pattern where July and August typically see positive stock performance, followed by a dip in late summer and a rally into the year-end. Image: BofA Global Research