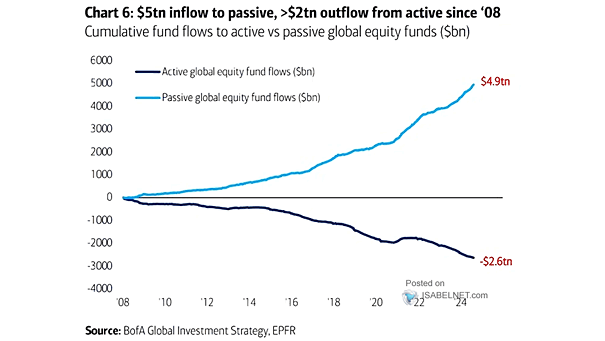
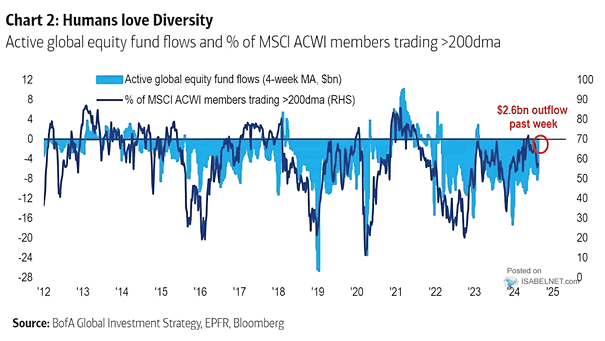
Market – Current Pricing of Policy, Political and Macro Outcomes

Market – Current Pricing of Policy, Political and Macro Outcomes Investors are confidently predicting a 100% chance of a Fed rate cut on September 18, a 75% likelihood of Donald Trump winning the U.S. election on November 5, and a 68% probability of a soft landing within the next 12 months. Image: BofA Global Investment…

Performance – Large Cap Growth vs. Small Cap Value

Performance – Large Cap Growth vs. Small Cap Value Large-cap growth stocks are outperforming small-cap value stocks at a level not seen since the dot-com bubble era. Historical patterns and the potential for economic recovery indicate that this trend may change in the long term. Image: BofA Global Investment Strategy

Performance – Ratio of Russell 2000 Index to Nasdaq Composite

Performance – Ratio of Russell 2000 Index to Nasdaq Composite Small-cap stocks are currently at a record low relative to the Nasdaq Composite. Factors that could drive small-cap stocks to outperform include a rise in M&A and IPOs, robust earnings growth, and changes in interest rates. Image: BofA Global Investment Strategy

U.S. GDP Growth

U.S. GDP Growth BofA forecasts a robust U.S. GDP growth of 2.3% quarter-over-quarter (QoQ) seasonally adjusted annual rate (SAAR) in Q2 2024, reflecting the bank’s confidence in the resilience of the American economy. Image: BofA Global Research

Cumulative Global Equity Fund Flows Across Regions

Cumulative Global Equity Fund Flows Across Regions In 2024, U.S. equities have seen notable inflows, indicating a resurgence of investor confidence despite ongoing concerns about valuations. Image: Goldman Sachs Global Investment Research

S&P 500 Performance After >50% of the Components Make a 20-Day High

S&P 500 Performance After >50% of the Components Make a 20-Day High When more than 50% of S&P 500 components hit a 20-day high, the S&P 500 index tends to perform strongly in the following 12 months, with a median increase of 16.4% in value seen a year later since 1972. Image: Carson Investment Research

Cumulative Large Cap vs Small Cap Equity Flows

Cumulative Large Cap vs Small Cap Equity Flows Since 2021, U.S. large-cap funds have seen significantly higher inflows compared to U.S. small-cap funds, highlighting a broader trend of investor preference for larger, established companies. Image: BofA Global Investment Strategy

U.S. Small Cap Fund Flows

U.S. Small Cap Fund Flows The recent surge in inflows to U.S. small-cap funds highlights a favorable outlook on small-cap stocks as an investment option, as investors appear to be reallocating some of their assets toward this market segment. Image: BofA Global Investment Strategy

Performance – U.S. vs. Global ex-U.S.

Performance – U.S. vs. Global ex-U.S. Given that U.S. equities are at record highs compared to global stocks, should long-term investors consider reallocating a larger portion of their portfolios to global ex-U.S. stocks instead of heavily investing in U.S. equities? Image: BofA Global Investment Strategy

Inflation – U.S. Core PCE and Core CPI

Inflation – U.S. Core PCE and Core CPI Goldman Sachs’ forecast of a continuous decline in U.S. core PCE and core CPI suggests a potential slowdown in inflationary pressures, which could have significant implications for the overall economic outlook. Image: Goldman Sachs Global Investment Research