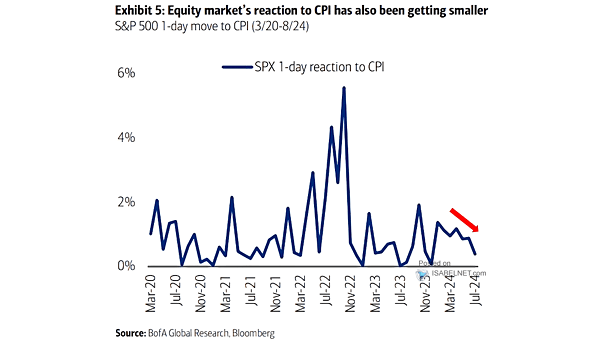
S&P 500 1-Day Move to CPI
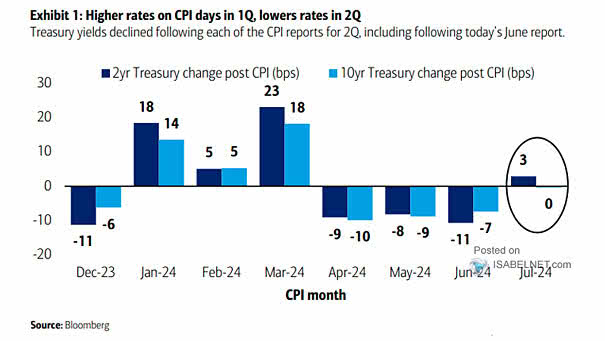
S&P 500 1-Day Move to CPI The U.S. equity market’s response to CPI data is becoming less pronounced, influenced by shifting investor sentiment about interest rates and overall economic conditions. Image: BofA Global Research