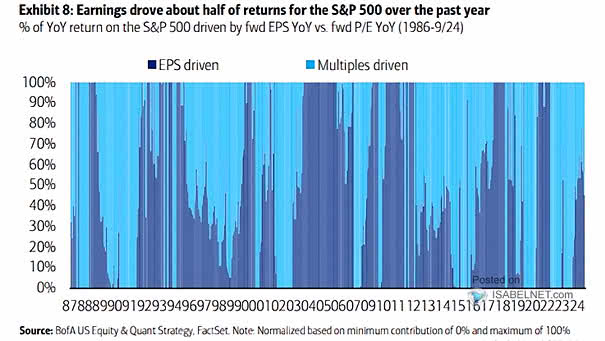
S&P 500 Earnings
S&P 500 Earnings The impressive returns of the S&P 500 over the past year have been largely driven by earnings, particularly from a handful of high-performing tech stocks. Image: BofA US Equity & Quant Strategy
S&P 500 Earnings The impressive returns of the S&P 500 over the past year have been largely driven by earnings, particularly from a handful of high-performing tech stocks. Image: BofA US Equity & Quant Strategy
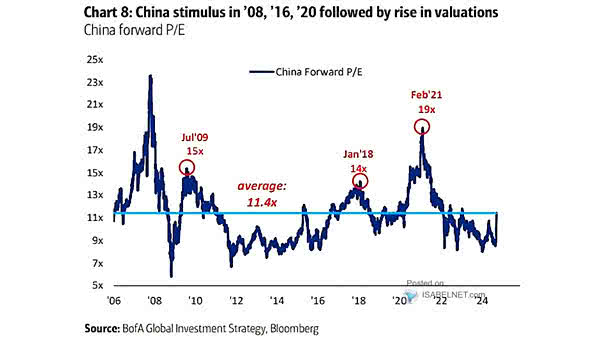
Equities – China’s Valuations If the MSCI China P/E ratio increases from its current range of 11-12x to a peak of 15-16x, this could represent a potential upside of approximately 40%. Image: BofA Global Investment Strategy
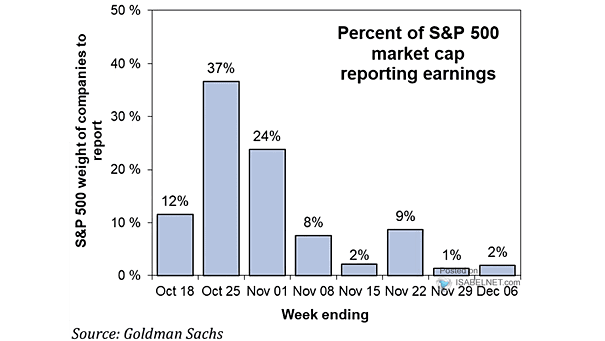
Percent of S&P 500 Market Cap Reporting Earnings With a significant number of S&P 500 companies set to report their earnings shortly, market participants will be closely monitoring these results for indications of economic health and sector-specific performance. Image: Goldman Sachs Global Investment Research
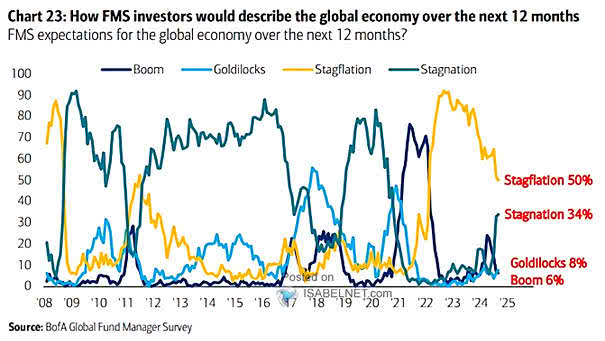
How FMS Investors Believe the Global Economy Trends Will Be in Next 12 Months 50% of FMS investors expect stagflation in the global economy over the next 12 months, marked by stagnant growth and high inflation, while 34% foresee stagnation, leading to a cautious investment approach. Image: BofA Global Fund Manager Survey
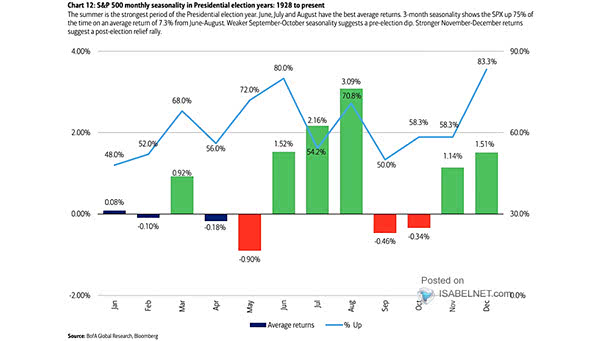
S&P 500 Monthly Returns and Percentage of Time Up – Presidential Cycle Year 4 Seasonality provides valuable insights into stock market trends. Historically, after experiencing weaknesses in September and October during election years, the S&P 500 tends to rebound with strong returns in November and December. Image: BofA Global Research
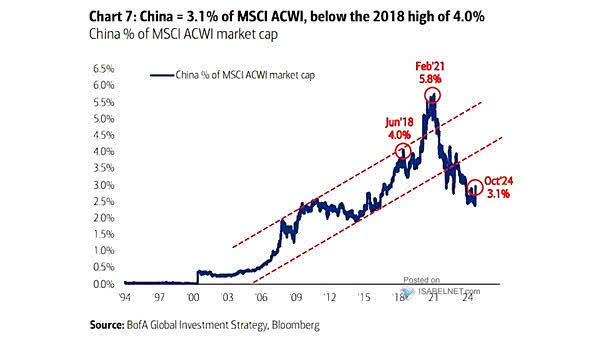
China as % of MSCI ACWI Market Capitalization Assuming that China’s market capitalization as a percentage of the MSCI ACWI rises to its 2018 high of 4.0%, this scenario presents a potential upside of approximately 30% for investors. Image: BofA Global Investment Strategy
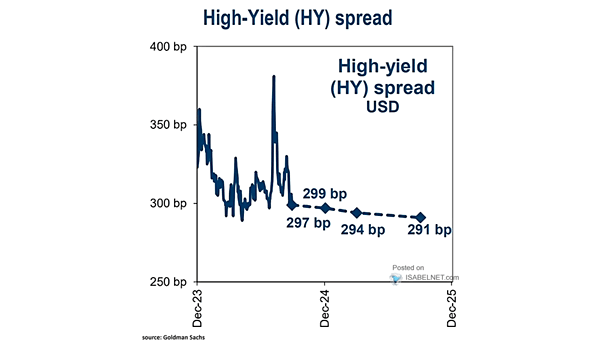
High-Yield (HY) Spread USD Goldman Sachs forecasts a favorable high-yield bond market over the next 12 months, anticipating tighter spreads as a result of robust economic conditions and optimistic investor sentiment. Image: Goldman Sachs Global Investment Research
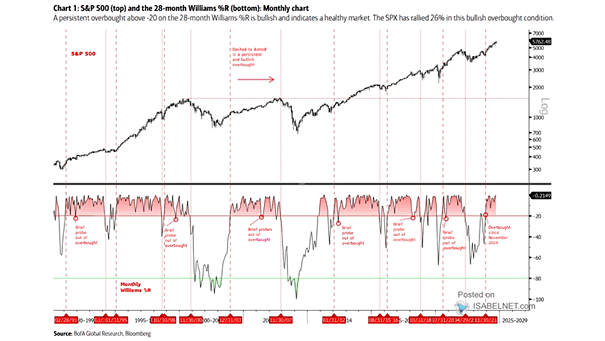
S&P 500 and the 28-Week Williams %R The Williams %R indicator is an effective tool for identifying overbought and oversold conditions in financial markets. A sustained overbought condition may indicate a healthy market. Image: BofA Global Research
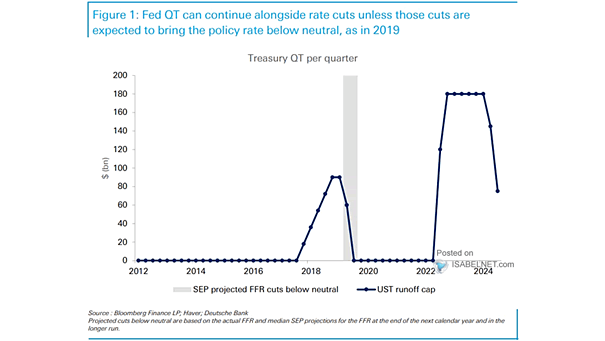
Treasury QT The current context suggests that QT can continue even as the Fed begins to cut interest rates, provided that these cuts do not push the policy rate below what is considered neutral. Image: Deutsche Bank
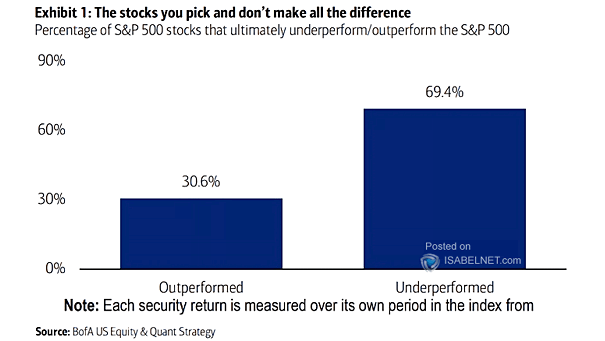
Percentage of S&P 500 Stocks That Ultimately Underperform/Outperform the S&P 500 When it comes to investing in the S&P 500, the stocks investors choose make all the difference in their investment journey, as the right choices can significantly improve returns. Image: BofA US Equity & Quant Strategy
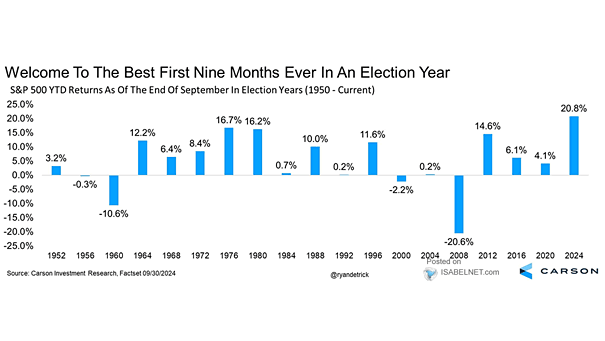
S&P 500 YTD Returns as of the End of September in Election Years The S&P 500 has demonstrated a remarkable performance in 2024, marking the best first nine months of an election year since 1950, driven by strong corporate earnings, resilient consumer spending, and investor optimism. Image: Carson Investment Research