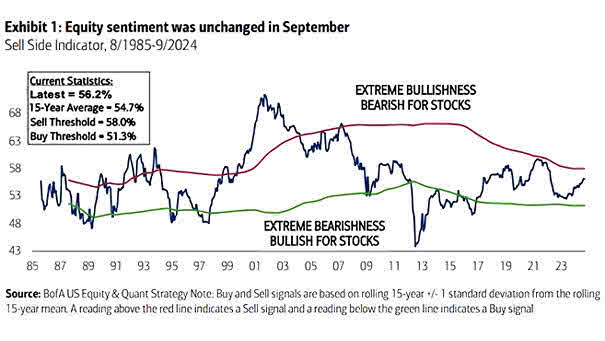
Sell Side Consensus Indicator

Sell Side Consensus Indicator The Sell Side Indicator, which tracks Wall Street strategists’ equity allocation recommendations, has remained unchanged in September. The current level suggests that the S&P 500 may see positive gains over the next 12 months. Image: BofA US Equity and Quant Strategy

ETF Gold Holdings

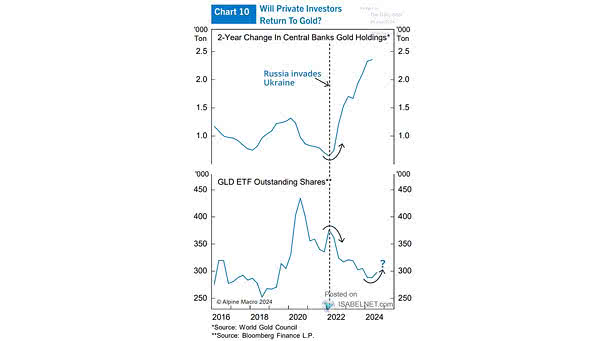
ETF Gold Holdings While gold prices have reached new highs, household investor participation remains low, sharply contrasting with the aggressive buying strategies employed by central banks. Image: BofA Global Research

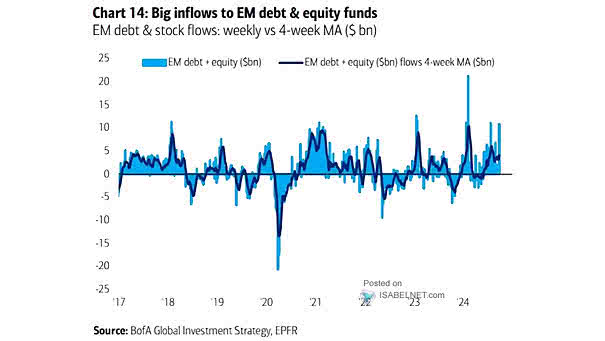
Emerging Market Debt + Equity Flows

Emerging Market Debt + Equity Flows The substantial inflows into emerging market assets highlight a robust interest from investors. Image: BofA Global Investment Strategy

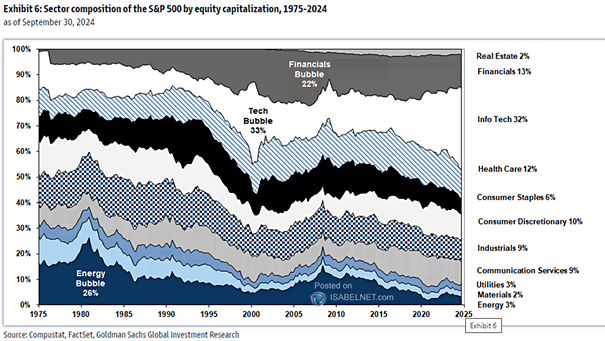
Sector Composition of the S&P 500 by Equity Capitalization

Sector Composition of the S&P 500 by Equity Capitalization The market capitalization of sectors within the S&P 500 reflects the market’s changing landscape, driven by economic conditions and investor sentiment, leading to fluctuations in sector performance over time. Image: Goldman Sachs Global Investment Research

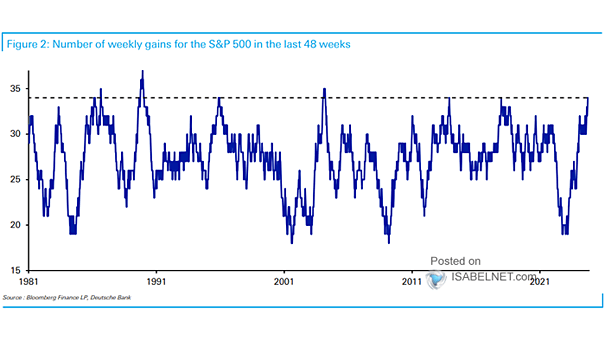
Number of Positive S&P 500 Weekly Performances in the Previous 48 Weeks

Number of Positive S&P 500 Weekly Performances in the Previous 48 Weeks The recent performance of the S&P 500 has been remarkable. Over the past 48 weeks, the S&P 500 has experienced 34 weeks of gains, which is relatively rare in the market, reflecting strong investor confidence. Image: Deutsche Bank

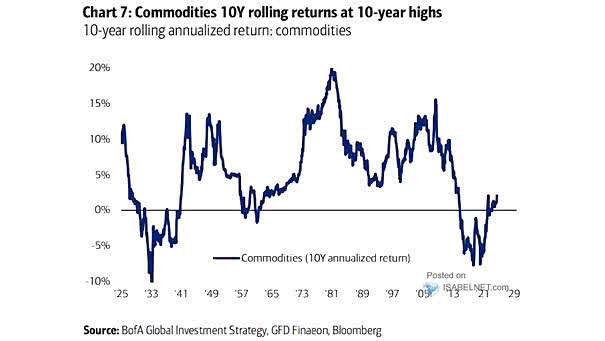
Commodities Rolling 10-Year Annualized Returns

Commodities Rolling 10-Year Annualized Returns Historically, commodity bull markets have lasted for extended periods, often a decade or more, and have the potential to generate substantial returns for investors who maintain their exposure throughout the cycle. Image: BofA Global Investment Strategy

Money Market Fund Flows

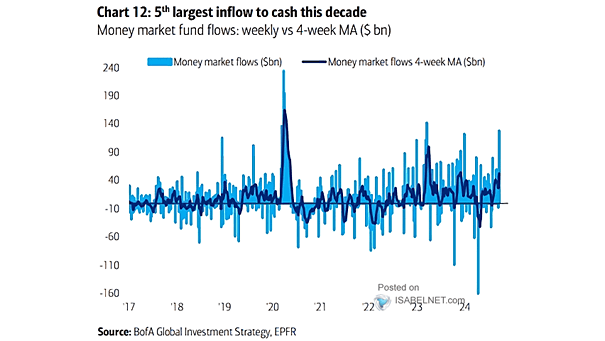
Money Market Fund Flows In the lead-up to U.S. elections, money market funds, which are seen as a safe haven, frequently see inflows as investors aim to lower their risk exposure. Image: BofA Global Investment Strategy

S&P 500 Index and Fed Funds Effective Rate

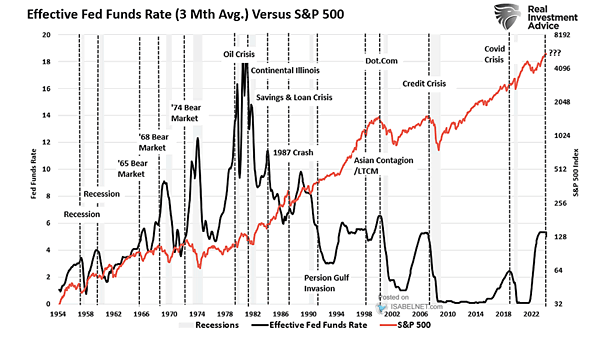
S&P 500 Index and Fed Funds Effective Rate While Fed rate cuts typically provide a short-term boost to market sentiment, historical trends suggest they often coincide with economic slowdowns. Image: Real Investment Advice

Average Gold Returns After Trading Certain Distances from 200-Day Moving Average

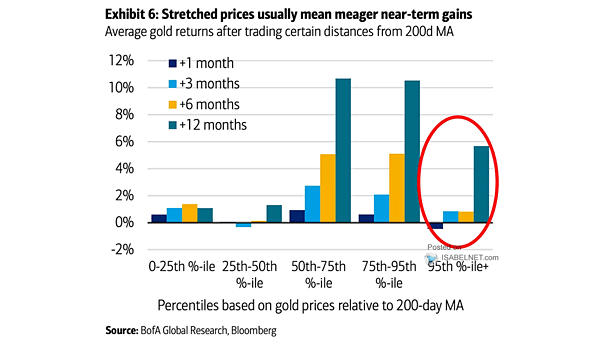
Average Gold Returns After Trading Certain Distances from 200-Day Moving Average Gold is currently 15% above the 200-day moving average, suggesting short-term bullish sentiment. However, historical trends indicate that investors should brace for potentially flat returns in the following 1 to 6 months after such extremes. Image: BofA Global Research

Central Bank Gold Holdings

Central Bank Gold Holdings Despite a significant gold price rally, private investors have largely been absent, especially compared to the aggressive purchases made by central banks. Image: Alpine Macro