U.S. Real Retail Sales and Recession
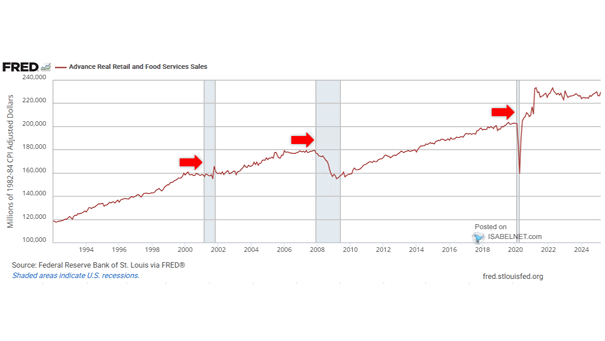
U.S. Real Retail Sales and Recession U.S. real retail sales stand at -0.22% YoY. About 70% of U.S. GDP is personal consumption. In the past, U.S. real retail sales trended sideways before the recession began.
U.S. Real Retail Sales and Recession U.S. real retail sales stand at -0.22% YoY. About 70% of U.S. GDP is personal consumption. In the past, U.S. real retail sales trended sideways before the recession began.
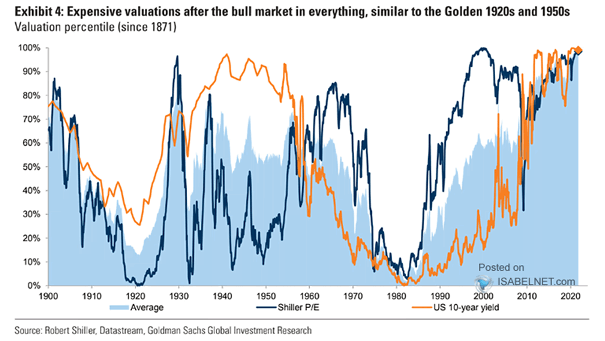
Valuation Percentile for Equity, Credit and Bond Valuations matter more over the medium term than in the moment. In years like 2025, robust growth let markets climb anyway, powered by rising profits despite high price tags. Image: Goldman Sachs Global Investment Research
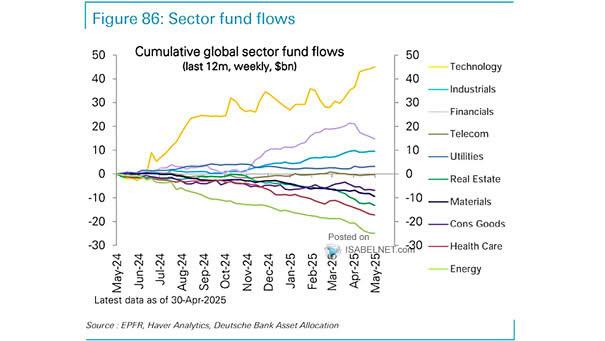
Global Sector Fund Flows Excluding Tech Sector funds outside Tech have drawn a record $62 billion in inflows over the first five weeks of the year, more than the total for all of 2025. The rush shows investors are widening their bets beyond the usual tech favorites. Image: Deutsche Bank Asset Allocation
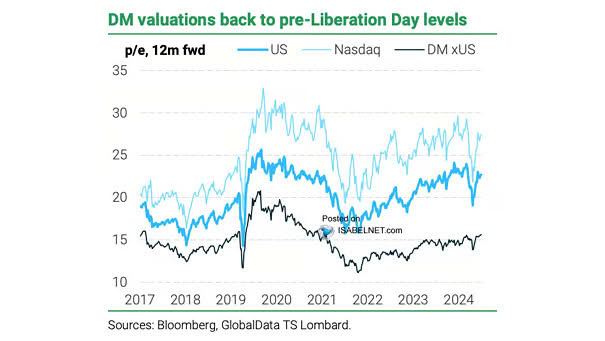
MSCI World Sector/Style Valuations With valuations running hot across sectors and styles, investors are turning more selective. Even so, a few pockets of value still glimmer beneath the surface. Image: Goldman Sachs Global Investment Research
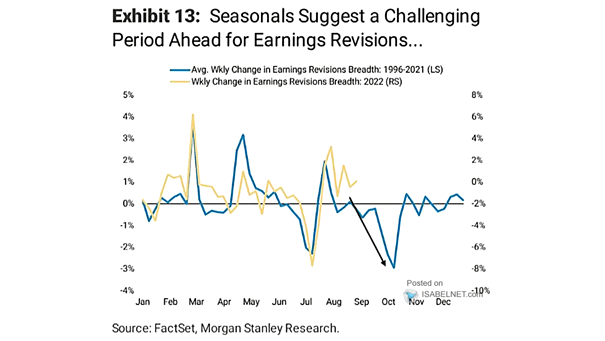
S&P 500 Earnings Revision Breadth The relationship isn’t perfect, but S&P 500 EPS revision breadth has often led market moves, showing a strong historical link with the index’s six‑month trailing returns. Image: Goldman Sachs Global Investment Research
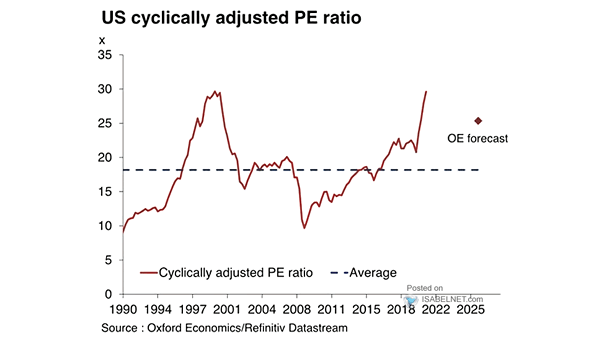
Valuation – S&P 500 Shiller Cyclically-Adjusted P/E Ratio vs. Model-Predicted P/E Ratio U.S. equities look expensive relative to both their own history and what today’s macro backdrop would normally justify. In past cycles, such stretches of pricey valuations have often been followed by years of subpar returns. Image: Goldman Sachs Global Investment Research
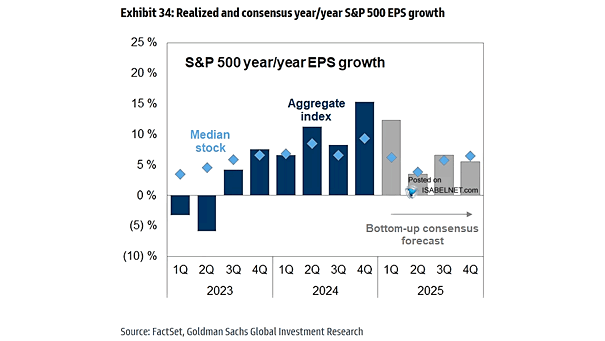
S&P 500 YoY EPS Growth Wall Street’s outlook for 2026 is bright, with analysts eyeing a 15% rise in S&P 500 earnings. While forecasts sound promising, markets often have surprises in store. Image: Goldman Sachs Global Investment Research
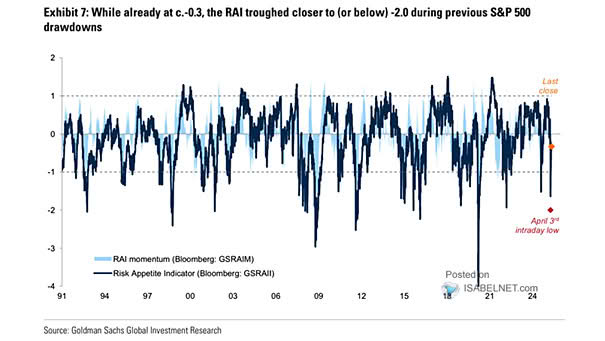
Risk Appetite Indicator Level and Momentum Factors Goldman Sachs’s Risk Appetite Indicator stays high, showing confidence remains strong across the market’s major players. Image: Goldman Sachs Global Investment Research
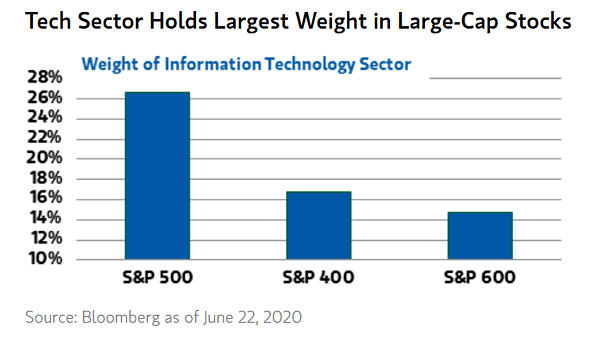
Sector Weights in the S&P 500 U.S. defensive sectors, excluding pharma and biotech, remain near their lowest share of the S&P 500 since 1990, even after a tech-led rotation nudged investors to trim some of their technology exposure. Image: Deutsche Bank
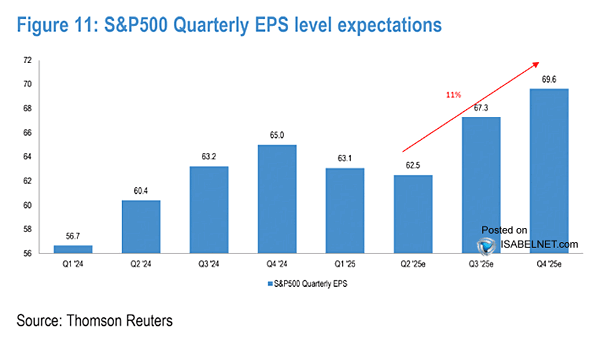
Factset S&P 500 Annual Bottom Up EPS Actual and Estimates Forecast upgrades for 2026 and 2027 keep rolling in, giving the S&P 500 another reason to push higher. The bulls still have the wind at their backs, and momentum isn’t showing any signs of slowing. Image: Carson Investment Research
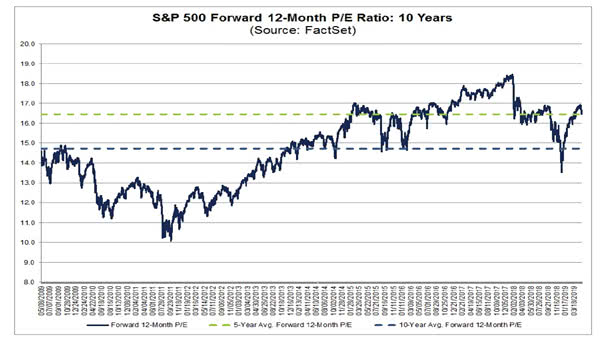
Valuations – 12-Month Fwd P/E Multiple. Worldscope Europe Sector Indices If you look at today’s valuation at 16.8x P/E and consensus revenues growth at around 9% annually, the risk of a slowdown in Software & IT Services is at least partly priced in already. Image: Goldman Sachs Global Investment Research