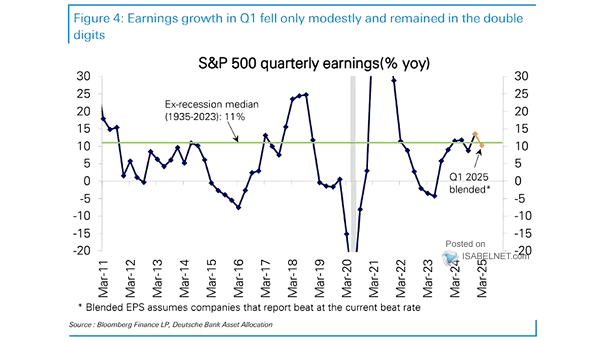
S&P 500 Performance During Government Shutdowns

S&P 500 Performance During Government Shutdowns Shutdown headlines can spark short-term volatility, yet the market’s track record tells a different story—since 1950, the S&P 500 has averaged a 12.7% rise in the 12 months after such episodes, posting gains about 86% of the time. Image: Carson Investment Research

Probability of S&P 500 Drawdown / Rally

Probability of S&P 500 Drawdown / Rally After a powerful rally, the S&P 500 looks stretched, and the odds of a near-term pullback—or at best, a sideways pause—are building. Image: Goldman Sachs Global Investment Research

Annual Average IPO Return During First Trading Day

Annual Average IPO Return During First Trading Day The average U.S. IPO in 2025 has popped 30% on debut, with 72% of the 46 listings this year finishing their first session in the green—a sign of the market’s strong appetite for new deals. Image: Goldman Sachs Global Investment Research

S&P 500 Performance Around Growth Score Peak

S&P 500 Performance Around Growth Score Peak U.S. equities tend to perform well on average following growth score peaks, particularly if there is no recession and policy easing occurs. In that backdrop, valuations can be pushed even further if macro conditions remain steady. Image: Goldman Sachs Global Investment Research

S&P 500 Valuation

S&P 500 Valuation Despite lofty valuations, the fuel behind U.S. stock market performance this year has been earnings growth, not multiple expansion. Image: Goldman Sachs Global Investment Research

S&P 500 Returns When New Highs Are Made In September

S&P 500 Returns When New Highs Are Made In September For the bulls, September’s new highs are more than just cosmetic. Since 1950, a new high in September has been followed by a fourth-quarter rally over 90% of the time, averaging gains of 4.7%. Image: Carson Investment Research

U.S. Heavy Truck Sales and Recessions (Leading Indicator)

U.S. Heavy Truck Sales and Recessions (Leading Indicator) U.S. heavy truck sales fell in August to 442K (annualized). Before recessions, heavy trucks sales tend to peak and then decline, providing insights into the overall health of the U.S. economy as a leading economic indicator. Click the Image to Enlarge

Buybacks – S&P 500 Companies in Blackout Period

Buybacks – S&P 500 Companies in Blackout Period S&P 500 companies are heading into their blackout window ahead of earnings season, a period when buyback activity tends to fade—though not completely disappear—for the next few weeks. Image: Deutsche Bank Asset Allocation

Survey – 10-Year U.S. Treasury Yields

Survey – 10-Year U.S. Treasury Yields While expectations tilt toward falling 10-year U.S. Treasury yields, plenty of voices argue for a rise, citing everything from sticky inflation to uncertain rate cuts and uneven economic growth. Image: Deutsche Bank

Equities – Global Valuation Range

Equities – Global Valuation Range U.S. stocks remain priced at a hefty premium, while valuations outside the U.S. are closer to historical norms. That leaves global markets offering stronger relative value, even if they’re not a bargain in absolute terms. Image: Goldman Sachs Global Investment Research

S&P 500 Performance Around First Fed Cut

S&P 500 Performance Around First Fed Cut When the U.S. economy grows and monetary easing comes without recession risk, large-cap equities usually lead, fueled by lower borrowing costs, rising profitability, and stable economic conditions. Image: Goldman Sachs Global Investment Research