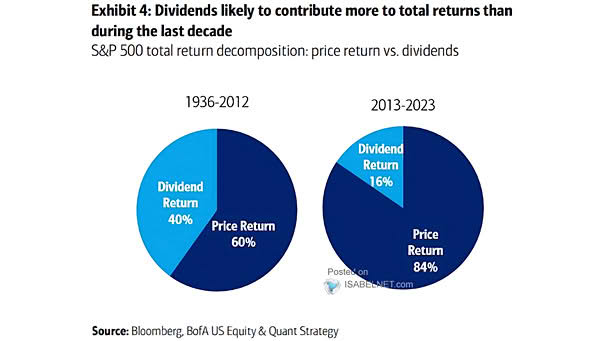
Decomposition of S&P 500 Total Returns
Decomposition of S&P 500 Total Returns According to BofA, dividends are expected to play a larger role in S&P 500’s total returns in the future than they have over the past decade. Image: BofA US Equity & Quant Strategy