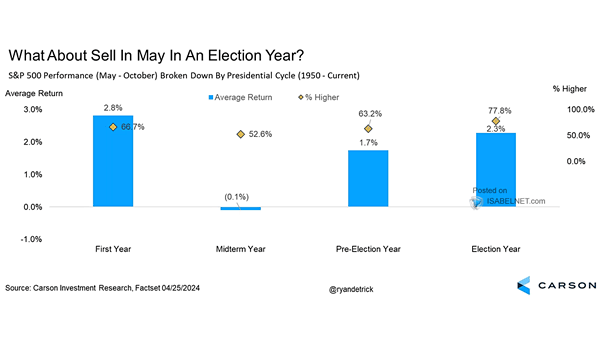
S&P 500 Performance (May – October) Broken Down by Presidential Cycle
S&P 500 Performance (May – October) Broken Down by Presidential Cycle Sell in May and go away? Since 1950, the S&P 500 has shown an average return of 2.3% during the period from May through October in election years, making it an attractive period for investors. Image: Carson Investment Research