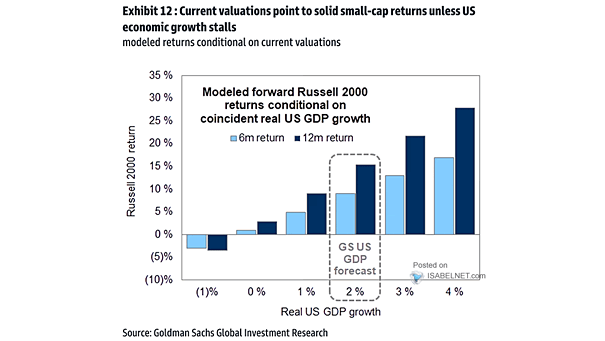
Most Short Basket Rolling 3-Month Return

Most Short Basket Rolling 3-Month Return A basket of most-shorted U.S. stocks has fallen significantly over the last three months. Image: Goldman Sachs Global Investment Research

S&P 500 and 12-Month Rate of Change in Margin Debt

S&P 500 and 12-Month Rate of Change in Margin Debt The rise in margin debt in June and July can be seen as a bullish signal for U.S. equities, indicating increased optimism and risk appetite among investors. Image: BofA Global Research Click the Image to Enlarge

U.S. Equity Issuance

U.S. Equity Issuance Despite the improvement in macroeconomic conditions, the issuance of U.S. equity and equity-linked securities has been relatively weak this year. Image: Goldman Sachs Global Investment Research

S&P 500 vs. Top 10

S&P 500 vs. Top 10 Investors can benefit from the currently wide valuation dispersion by focusing on low beta stocks that have stable cash flows and strong balance sheets. Image: J.P. Morgan Asset Management

Sentiment – Equity Put/Call Ratio

Sentiment – Equity Put/Call Ratio The CBOE U.S. equity put/call ratio is often seen as a contrarian indicator. Image: BofA Global Investment Strategy

U.S. Stock Market Valuation – Cape Ratio

U.S. Stock Market Valuation – Cape Ratio The S&P 500’s CAPE ratio remains historically high, which could potentially lead to lower subsequent returns over the following 10 years. Image: Real Investment Advice