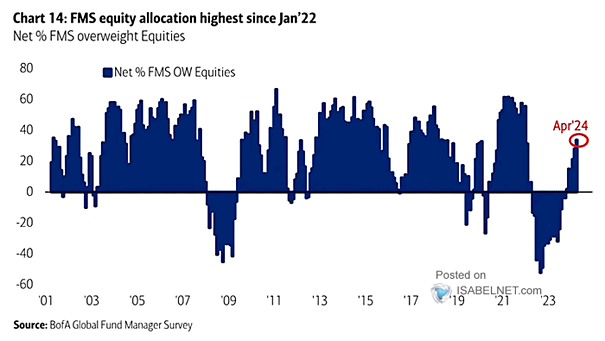
FMS Investors – Net % Overweight Equities – Net % Overweight Cash

FMS Investors – Net % Overweight Equities – Net % Overweight Cash FMS investors still show a greater inclination to invest in the stock market and less interest in holding cash, indicating their ongoing preference for higher-risk assets over cash reserves. Image: BofA Global Fund Manager Survey
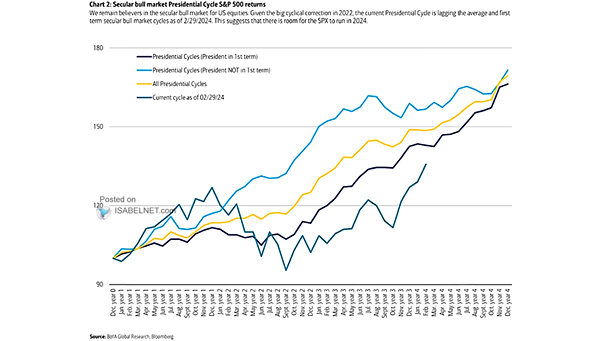
S&P 500 Presidential Cycle

S&P 500 Presidential Cycle Considering the substantial cyclical correction in 2022, the current presidential cycle suggests that there is potential for the S&P 500 to perform well in 2024. Image: BofA Global Research

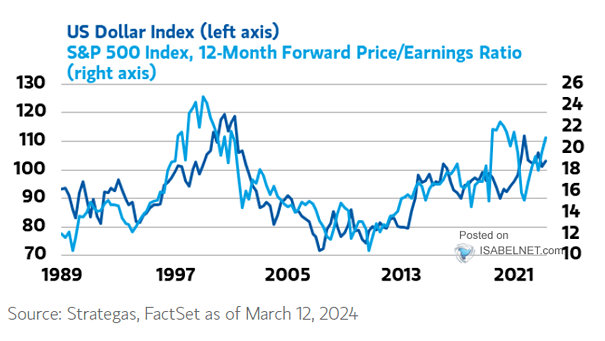
U.S. Dollar vs. S&P 500 Index Forward Price/Earnings

U.S. Dollar vs. S&P 500 Index Forward Price/Earnings Keeping a close eye on the correlation between the U.S. dollar and S&P 500 valuation multiples is essential, especially considering the potential end of the greenback’s bull market cycle. Image: Morgan Stanley Wealth Management

Interest Rates – Fed Funds Rate

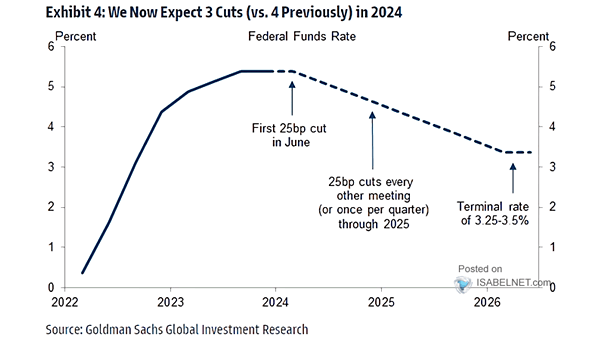
Interest Rates – Fed Funds Rate Goldman Sachs now expects the Fed to implement three rate cuts in 2024, down from its earlier projection of four rate cuts, in response to elevated inflation data and evolving economic conditions. Image: Goldman Sachs Global Investment Research

Market-Implied Long-Term S&P 500 Growth Expectations

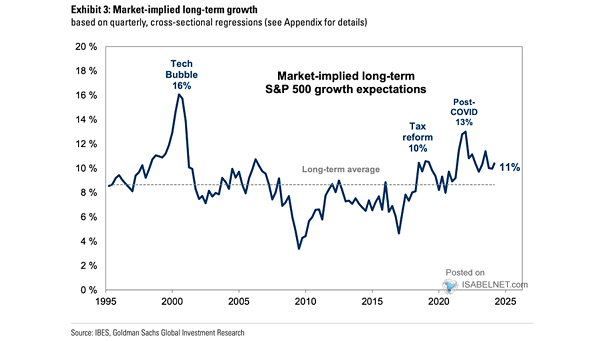
Market-Implied Long-Term S&P 500 Growth Expectations The implied long-term growth rate for the S&P 500 is currently +11%, which is above the long-term average but still below the levels seen during the tech bubble. Image: Goldman Sachs Global Investment Research

Inflation – Potential Paths for U.S. Core CPI

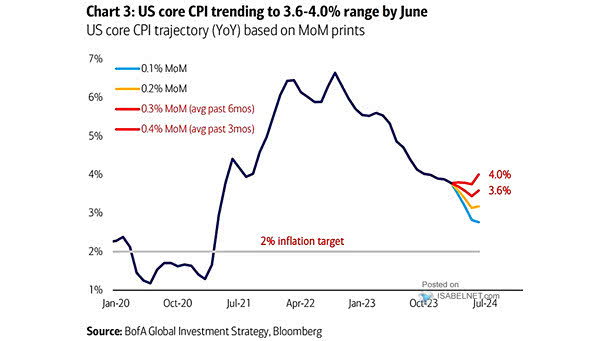
Inflation – Potential Paths for U.S. Core CPI If the Fed cuts rates in June, U.S. core CPI is expected to exceed the Fed’s 2% inflation target, which could pose challenges for the central bank in maintaining price stability. Image: BofA Global Investment Strategy

S&P 500 NTM EPS vs. Total Return Level

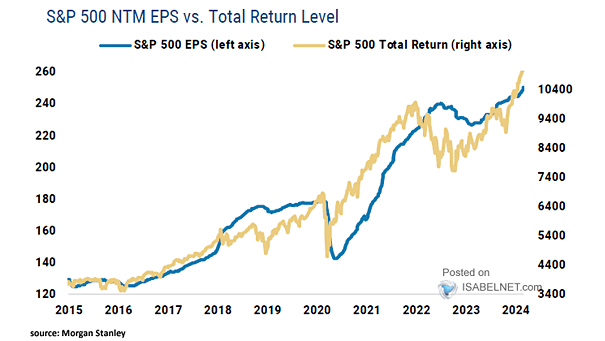
S&P 500 NTM EPS vs. Total Return Level NTM EPS estimates exert a powerful influence on the performance and direction of the U.S. equity market, making them a significant driving force. Image: Morgan Stanley Research

Returns – S&P 500 Index >5% YTD on Day 50

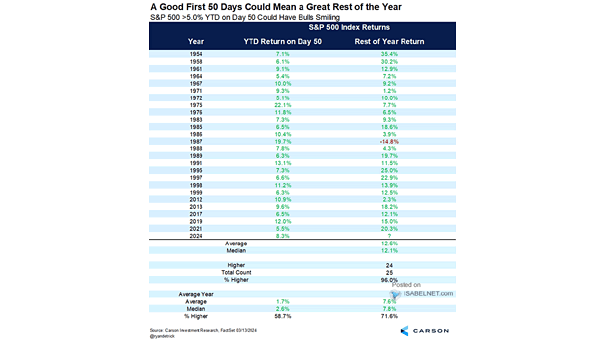
Returns – S&P 500 Index >5% YTD on Day 50 Since 1954, when the S&P 500 index has risen by more than 5% on day 50, the rest of the year has been higher 96% of the time, with an average gain of 12.6%. Image: Carson Investment Research

When Do You Expect the U.S. Equity Market Will Peak?

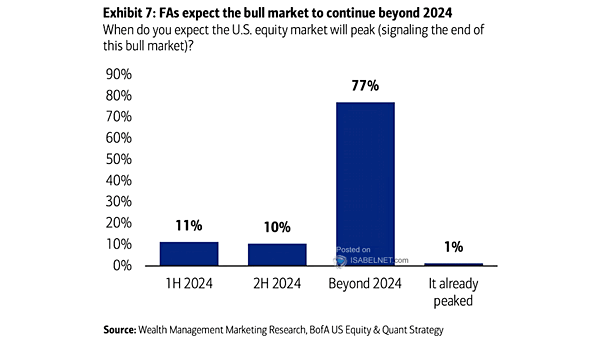
When Do You Expect the U.S. Equity Market Will Peak? 77% of financial advisors believe the bull market will continue beyond 2024, as they expect stellar corporate results, easy financial conditions, and lower interest rates to support its continuation. Image: BofA US Equity & Quant Strategy

S&P 500 and Deviation Above 50-Day Moving Average

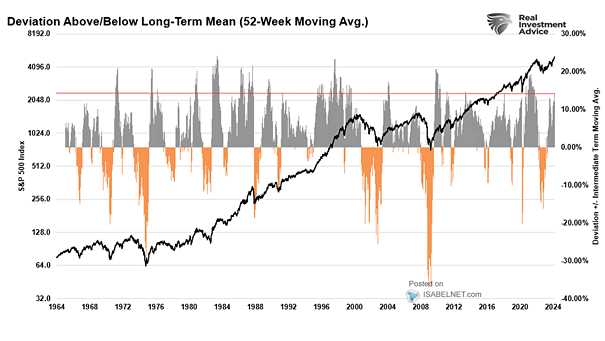
S&P 500 and Deviation Above 50-Day Moving Average As the deviation of the S&P 500 index from its 50-day moving average is reaching extreme levels, speculation mounts regarding the potential for a short-term market correction. Image: Real Investment Advice

U.S. 10-Year Real Rate

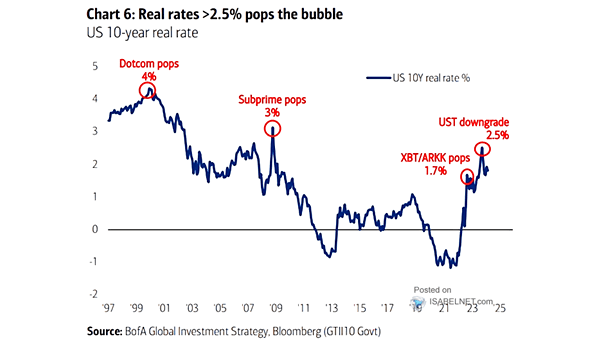
U.S. 10-Year Real Rate A potential rise in U.S. real rates could cause the collapse of the AI bubble, leading to turbulence in the stock market. Overvalued AI companies facing declines could trigger widespread market instability, eroding investor confidence. Image: BofA Global Investment Strategy