Euro to U.S. Dollar (EUR/USD)
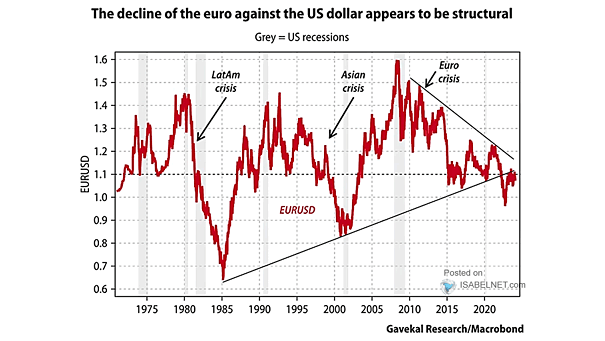
Euro to U.S. Dollar (EUR/USD) The euro’s decrease in value relative to the U.S. dollar seems to be a result of underlying structural factors. Image: Gavekal, Macrobond
Euro to U.S. Dollar (EUR/USD) The euro’s decrease in value relative to the U.S. dollar seems to be a result of underlying structural factors. Image: Gavekal, Macrobond
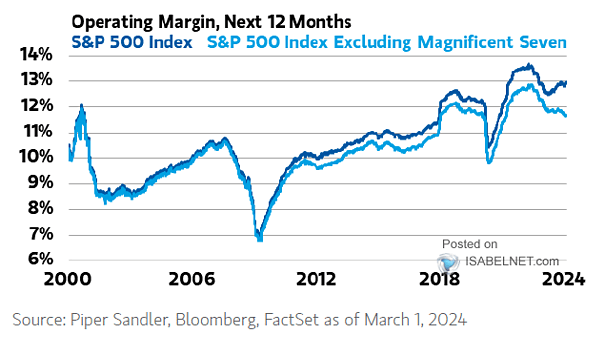
S&P 500 Index – Estimated Next 12-Month Operating Margin The decline in S&P 500 operating margins excluding the Magnificent Seven persists, suggesting that margin headwinds could remain challenging. Image: Morgan Stanley Wealth Management
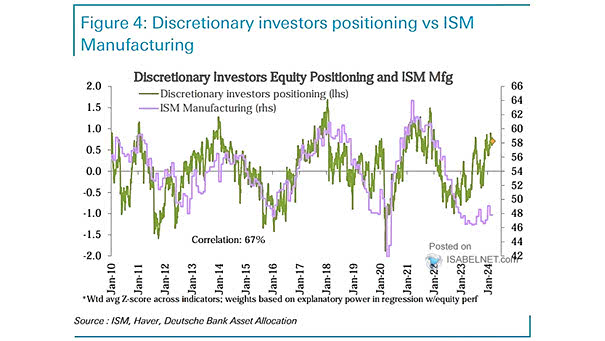
Discretionary Investors Equity Positioning and ISM Manufacturing The current discretionary equity positioning already reflects the idea of a “no landing” scenario. Image: Deutsche Bank Asset Allocation
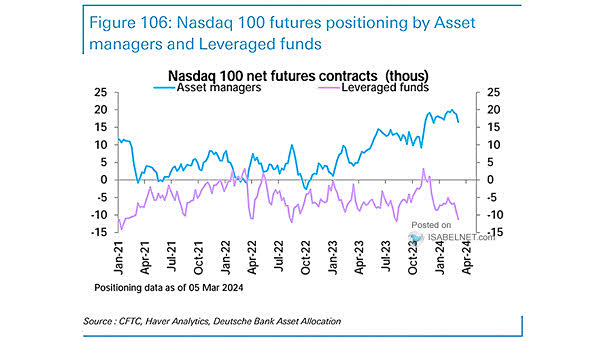
Nasdaq 100 Net Long Futures Contracts Leveraged funds and asset managers have different positions on Nasdaq 100 futures. Leveraged funds are currently very net short on Nasdaq 100 futures, while asset managers have a less bullish but still net long position. Image: Deutsche Bank Asset Allocation
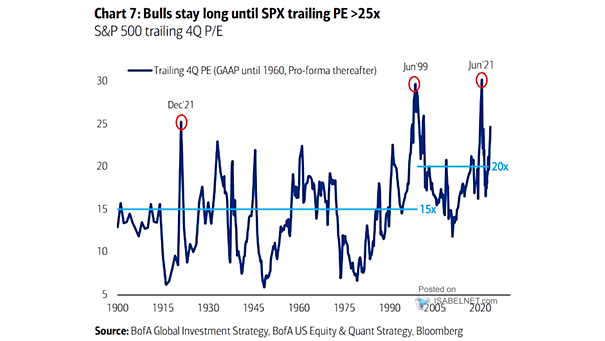
Valuation – S&P 500 Trailing 4Q P/E Bullish investors stay long until the trailing PE ratio of the S&P 500 exceeds 25x, signaling potential overvaluation and higher risk, prompting reassessment and defensive strategy shift. Image: BofA Global Investment Strategy
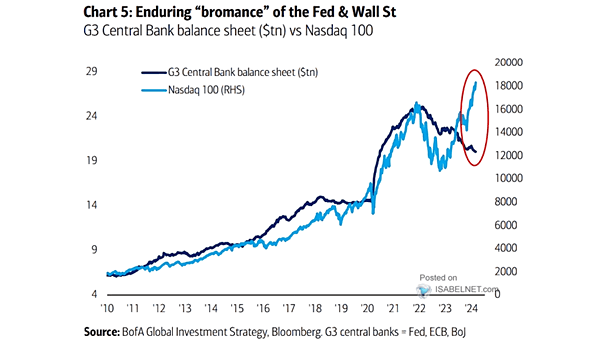
Tech Stocks – G3 Central Bank Balance Sheet vs. Nasdaq 100 Will the divergence between central bank liquidity and tech stock performance continue through 2024? Image: BofA Global Investment Strategy
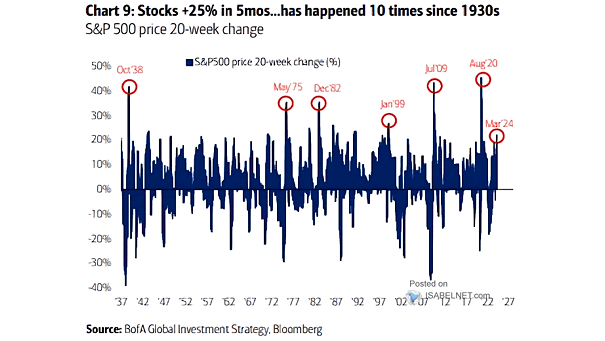
S&P 500 Price 20-Week Change Since the 1930s, there have been 10 instances of U.S. stocks gaining over 25% in just five months, demonstrating the market’s potential for rapid and significant growth in a relatively short space of time. Image: BofA Global Investment Strategy
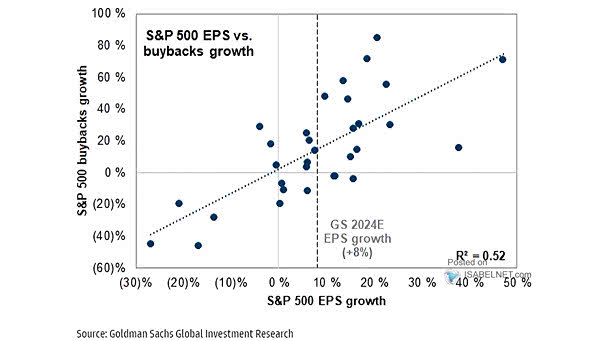
S&P 500 EPS Growth vs. Buyback Growth While EPS growth may be one factor influencing a company’s decision to repurchase its own shares, it is just one of many potential drivers of buyback activity. Image: Goldman Sachs Global Investment Research
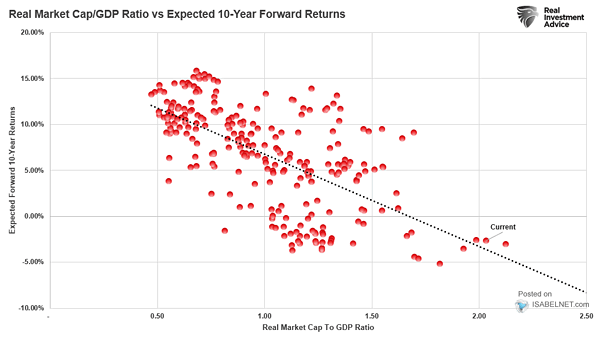
Real Market Cap to GDP Ratio vs. Expected 10-Year Forward Returns The current elevated inflation-adjusted market capitalization to GDP ratio suggests the likelihood of anemic returns for the U.S. stock market over the next 10 years. Image: Real Investment Advice
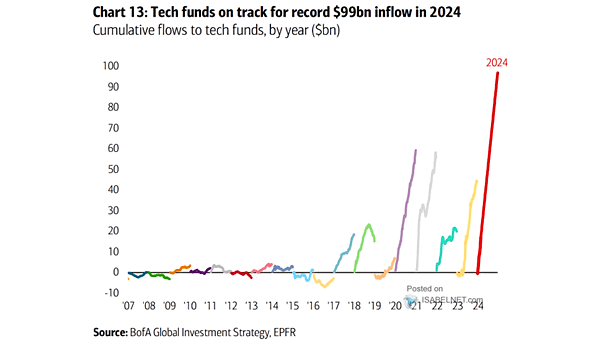
Tech Flows (Annual Inflows to Tech) The significant inflows into tech funds highlight investors’ continued interest in the sector’s growth and innovation potential. Image: BofA Global Investment Strategy
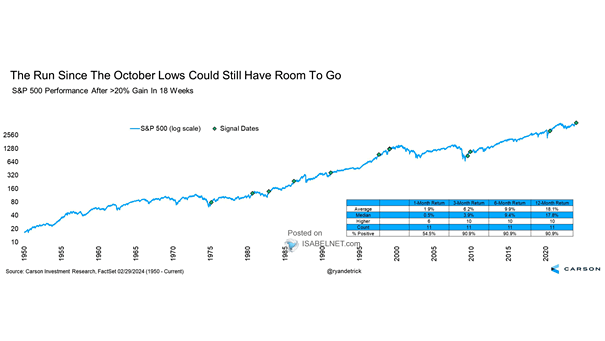
S&P 500 Performance After >20% Gain in 18 Weeks The S&P 500 index has historically shown strong performance after >20% gains in 18 weeks. On average, one year later, the index has increased in value by 18.1% since 1950. Image: Carson Investment Research