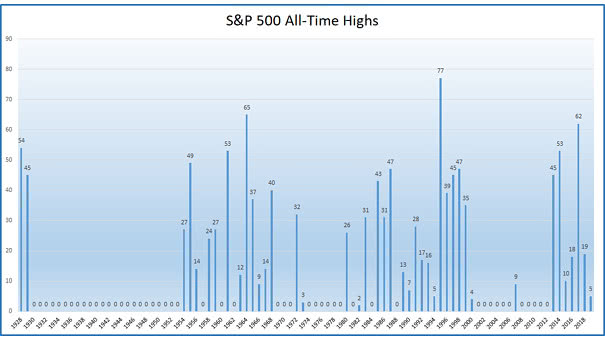
S&P 500 – Investing at All-Time Highs vs. All Other Days
S&P 500 – Investing at All-Time Highs vs. All Other Days Investing at all-time highs tends to spook investors, but the data suggests otherwise: S&P 500 forward returns have typically looked much like those from any other day. Missing the market has usually cost more than buying at the top. Image: Carson Investment Research