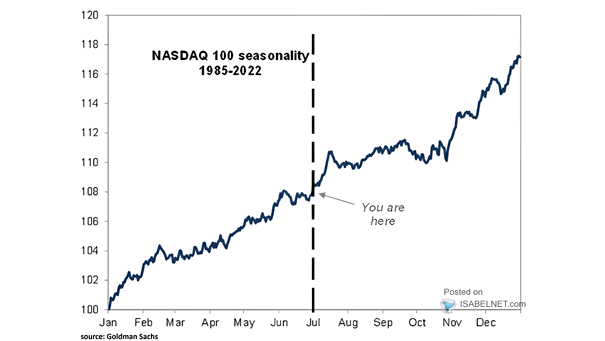
Nasdaq 100 Seasonality
Nasdaq 100 Seasonality Historically, July tends to be a good month for the Nasdaq 100 index, with seasonal patterns showing positive performance. Image: Goldman Sachs Global Investment Research
Nasdaq 100 Seasonality Historically, July tends to be a good month for the Nasdaq 100 index, with seasonal patterns showing positive performance. Image: Goldman Sachs Global Investment Research
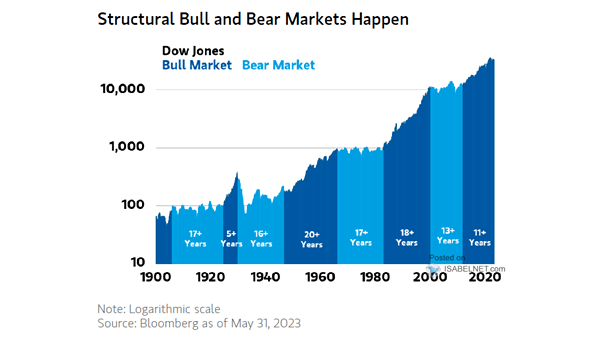
Structural Bull and Bear Markets Structural bear markets can be very painful for investors, as they can lead to prolonged periods of market decline and economic hardship. Image: Morgan Stanley Wealth Management
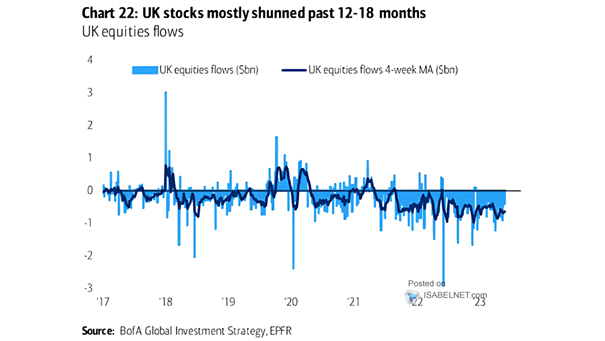
UK Equities Flows UK equities continue to experience outflows. Image: BofA Global Investment Strategy
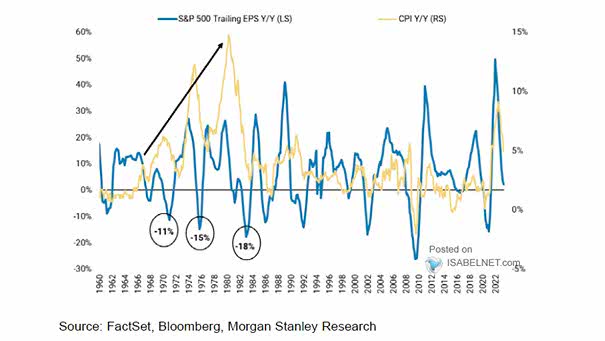
Earnings – S&P 500 Trailing EPS vs. CPI Periods of high inflation can be harmful to earnings. Image: Morgan Stanley Research
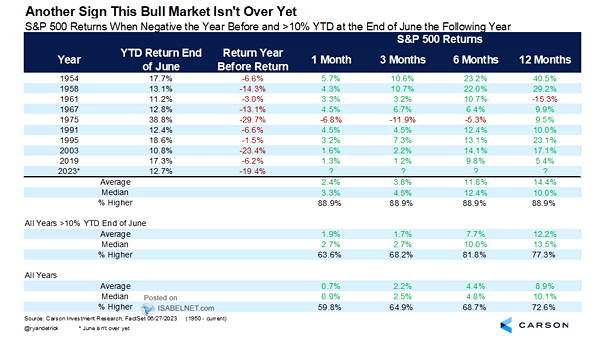
S&P 500 Returns When >10% at the End of June When the previous year is negative, a strong performance of the S&P 500 in the first half of the year typically results in a solid return in the second half. Image: Carson Investment Research
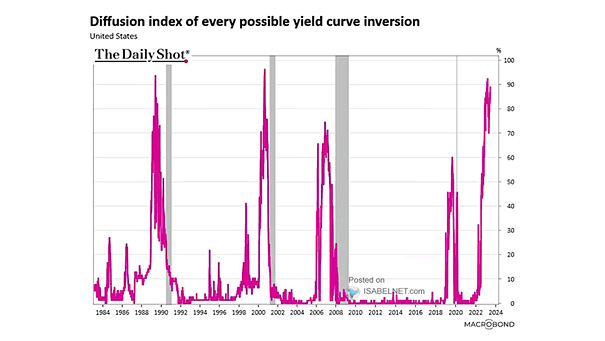
Recession – Diffusion Index of Every Possible Yield Curve Inversion The increasing number of inverted yield curves is a negative sign, but does not necessarily mean that a recession is imminent. Image: Macrobond
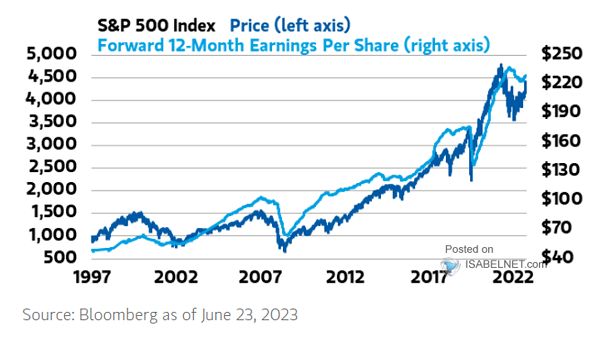
S&P 500 Index and Forward 12-Month Earnings Per Share The S&P 500 Index always follows earnings. Image: Morgan Stanley Wealth Management
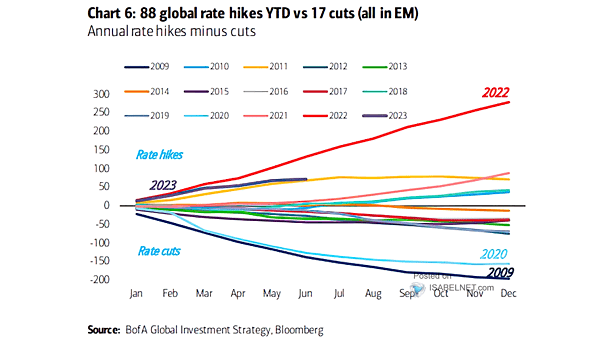
Global Central Bank Rate Cuts vs. Hikes Since the beginning of the year, there have been more global rate hikes than global rate cuts. Image: BofA Global Credit Research
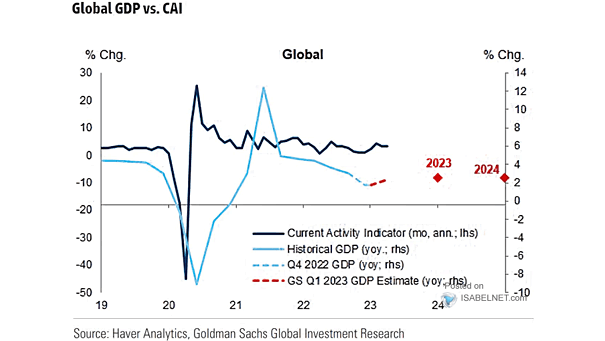
Global Real GDP Growth vs. Current Activity Indicator (CAI) Goldman Sachs forecasts global real GDP growth of 2.5% in 2023. Image: Goldman Sachs Global Investment Research
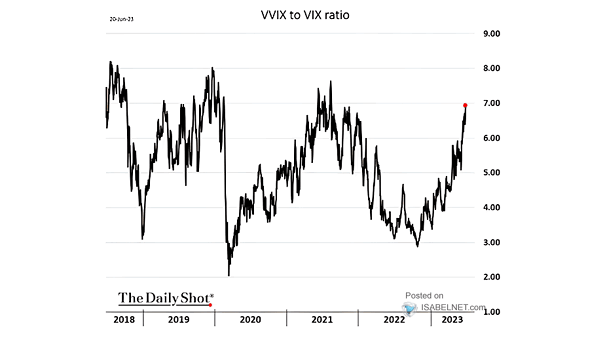
VVIX to VIX Ratio The VVIX/VIX ratio continues to rise, suggesting a period of relative complacency. Image: The Daily Shot
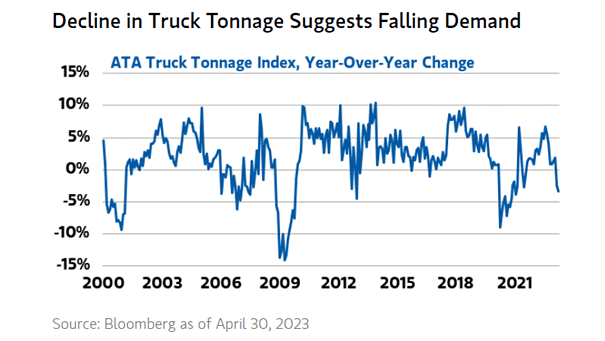
ATA Truck Tonnage Index The drop in truck tonnage indicates a decrease in demand. Image: Morgan Stanley Wealth Management