Eurozone Bank Lending Flow to Non-Financial Corporations
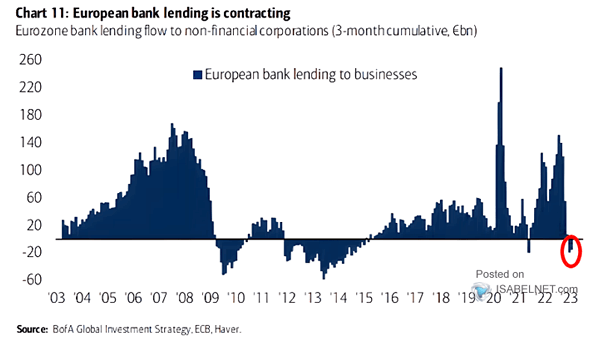
Eurozone Bank Lending Flow to Non-Financial Corporations Bank lending in the European area is contracting, which is unusual outside of crises. Image: BofA Global Investment Strategy
Eurozone Bank Lending Flow to Non-Financial Corporations Bank lending in the European area is contracting, which is unusual outside of crises. Image: BofA Global Investment Strategy
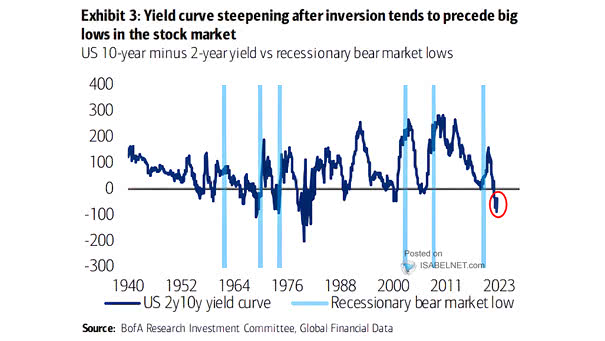
U.S. 10Y-2Y Yield Curve vs. Recessionary Bear Market Lows Historically, a steepening inverted US 10Y-2Y yield curve tends to precede recessionary bear market lows. Image: BofA Research Investment Committee
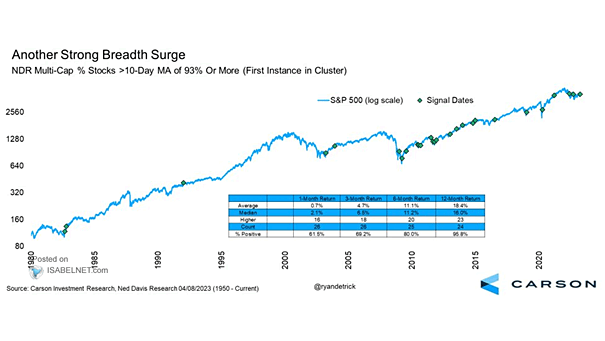
S&P 500 – NDR Multi-Cap % Stocks >10-Day Monving Average of 93% or More In recent history, when 93% of U.S. stocks or more are above their 10-day moving average, good things tend to happen over the next 12 months. Image: Carson Investment Research
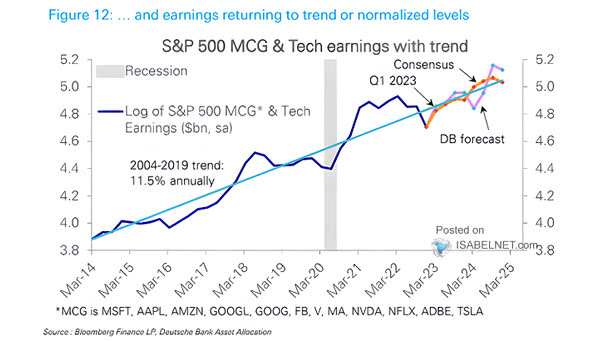
Mega-Cap Growth and Tech Earnings Do U.S. tech stocks still have room to climb? Deutsche Bank expects tech earnings to rebound. Image: Deutsche Bank
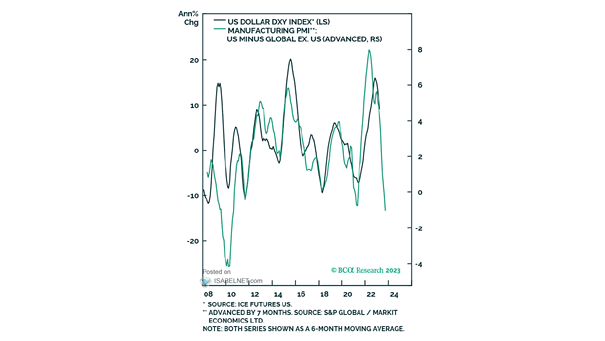
U.S. Dollar Index (DXY) vs. Manufacturing PMI (U.S. Minus Global Ex-U.S.) Will the U.S. dollar continue to weaken? Image: BCA Research
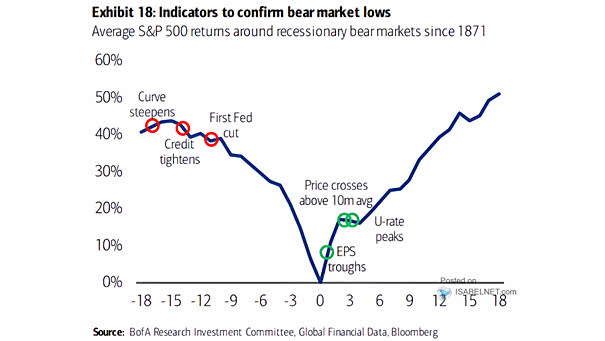
Average S&P 500 Returns Around Recessionary Bear Markets There are several indicators that can be used to confirm recessionary bear market lows. Image: BofA Research Investment Committee
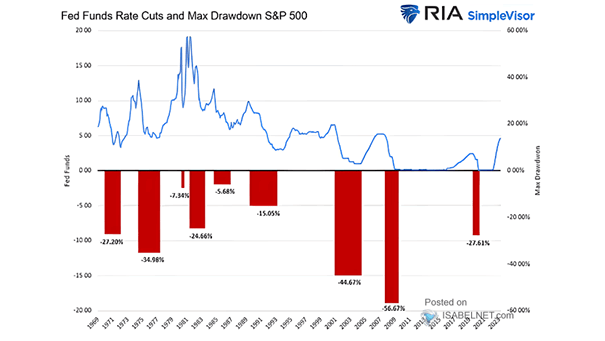
Fed Funds Rate Cuts and Max Drawdown S&P 500 Historically, Fed rate cuts are not bullish for the S&P 500. Image: Real Investment Advice
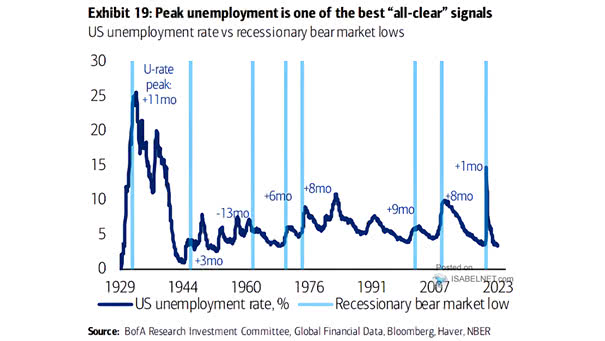
U.S. Unemployment Rate vs. Recessionary Bear Market Lows The peak in unemployment can be used as a signal for the end of a recessionary bear market in U.S. stocks. Image: BofA Research Investment Committee
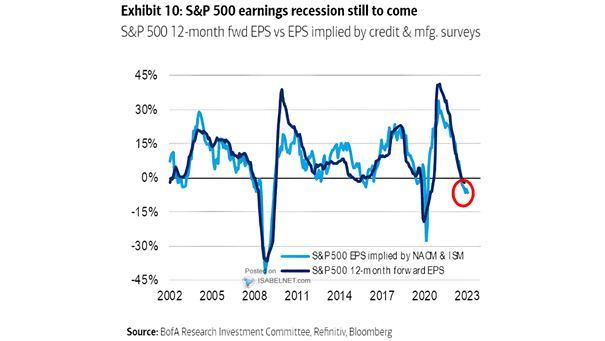
Earnings – S&P 500 12-Month Fwd EPS vs. EPS Implied by Credit and Manufacturing Surveys Could an earnings recession be a significant risk for U.S. stocks? Image: BofA Research Investment Committee

S&P 500 Price Returns Based on U.S. ISM Manufacturing PMI Levels The U.S. ISM Manufacturing PMI between 45 and 50 is historically bullish for U.S. stocks over the next 12 months. Image: MarketDesk Research
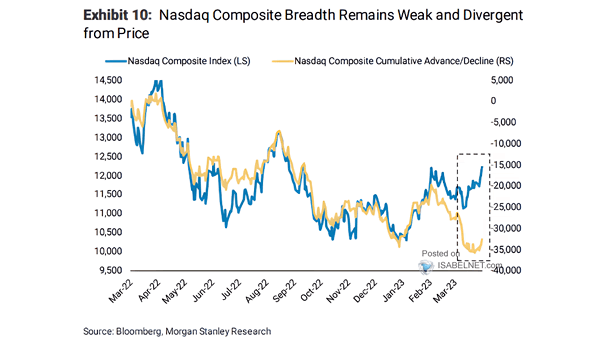
Nasdaq Composite Index vs. Nasdaq Composite Cumulative Advance/Decline The Nasdaq Composite’s breadth is not great. Image: Morgan Stanley Research