Rolling 20-Week Correlations of the S&P 500 to the Usual Havens

Rolling 20-Week Correlations of the S&P 500 to the Usual Havens During this decade’s market shocks, traditional havens have too often failed to hedge, frustrating investors who assumed they would shield portfolios. The takeaway: diversification has to be multidimensional and adaptive. Image: Deutsche Bank
U.S. Broad Money (M2)

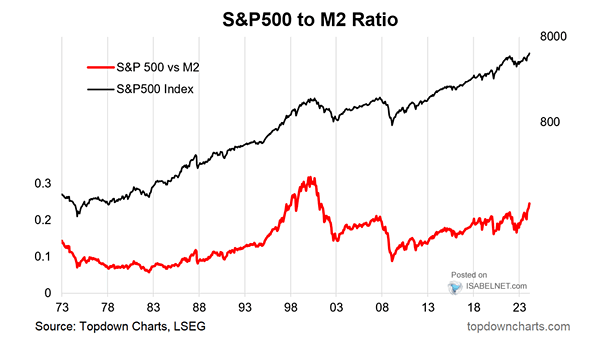
U.S. Broad Money (M2) After shrinking in 2022 and 2023, U.S. M2 growth has continued to expand. That’s good news for nominal spending and asset prices, but it also brings the familiar inflation question back into focus if money growth and velocity both stay hot. Image: Gavekal, Macrobond

Famous Market Bubbles: Peak-To-Trough Drawdowns

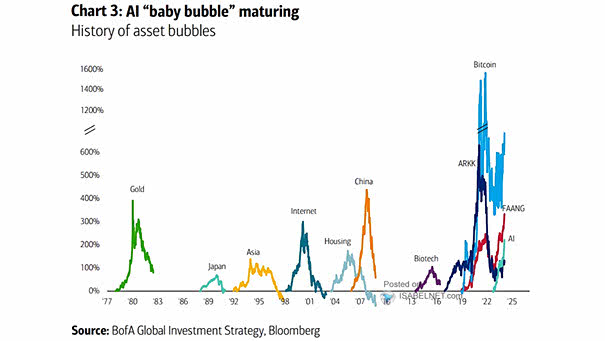
Famous Market Bubbles: Peak-To-Trough Drawdowns Major market bubbles rarely fade quietly. Losses can be severe, and getting back to even can take years, sometimes decades, as leverage unwinds, valuations reset, and confidence takes a hit. Image: Real Investment Advice

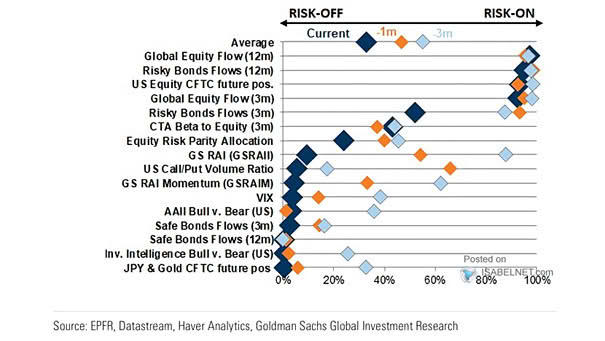
Different Market Sentiment Indicators

Different Market Sentiment Indicators Volatility has cooled over the past month, and sentiment is still risk-on, but the market is far from euphoric, leaving room for more upside into earnings season. Image: Goldman Sachs Global Investment Research

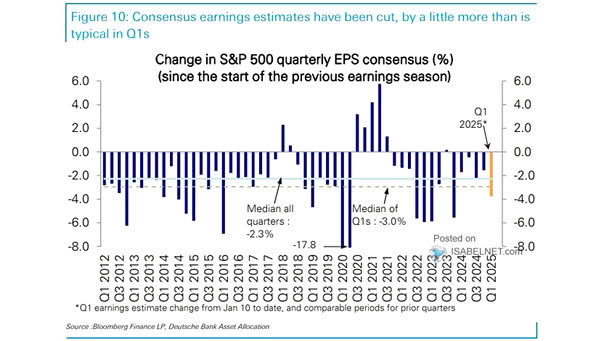
S&P 500 Quarterly EPS

S&P 500 Quarterly EPS For Q2 2026, analysts expect S&P 500 earnings to jump 22% from a year earlier, with tech once again doing almost all the work. The script hasn’t changed: technology remains the growth engine. Image: J.P. Morgan

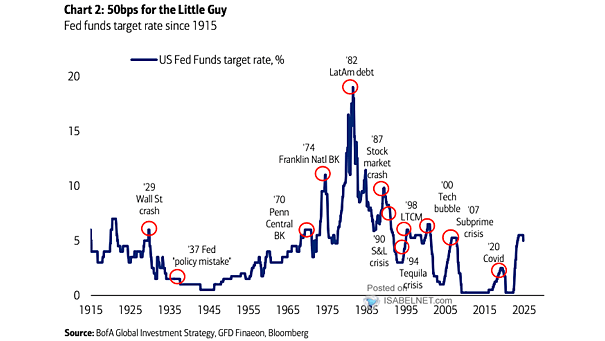
Fed Funds Rate

Fed Funds Rate The market’s baseline has shifted: traders see about 50 bp of Fed tightening over the next several months, something that would have been hard to believe in January. Image: Goldman Sachs Global Investment Research

S&P 500 and Trend Strength by Market Cap

S&P 500 and Trend Strength by Market Cap US small caps are leading the breadth picture, with 67% now trading above the 200-day moving average, the highest reading since 2021. That’s a healthy signal, but it doesn’t guarantee the outperformance will last. Image: Hi Mount Research

U.S. Dollar Index (DXY) and Purchasing Power Parity Valuation

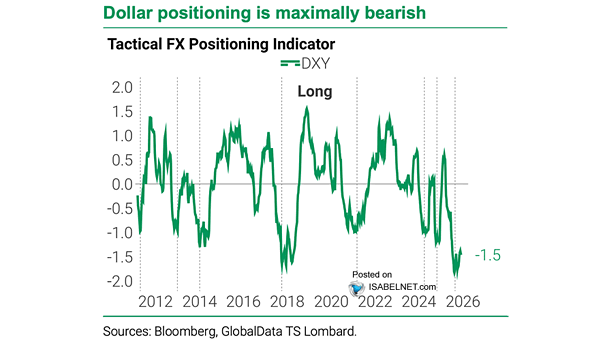
U.S. Dollar Index (DXY) and Purchasing Power Parity Valuation On key valuation metrics, the US dollar is still rich. That leaves little room for a sustained rally, especially as foreign demand has cooled since Liberation Day and valuations are already at the top of the range. Image: TS Lombard

Spot Gold

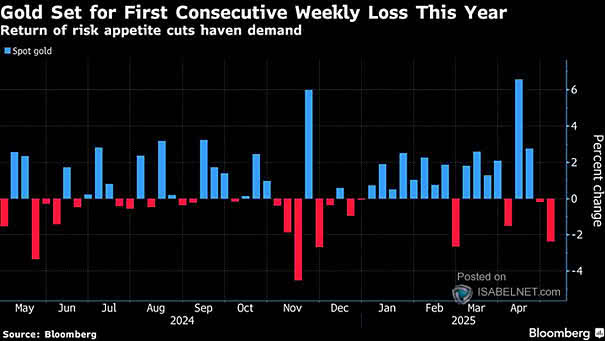
Spot Gold Gold is trading close to a seven-month low as a stronger dollar and expectations for higher-for-longer U.S. interest rates keep pressure on the metal. Image: MarketDesk Research

Announced Buybacks on Wilshire 5000

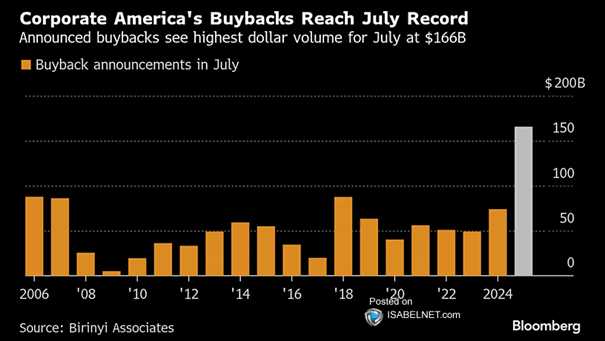
Announced Buybacks on Wilshire 5000 This year, announced buybacks are heading past $2 trillion, a new record. But there is a gap between what companies say and what they actually do. In practice, actual buybacks lag far behind the promises. Image: Bloomberg