Cumulative Change in Consensus 2026 EPS Estimates

Cumulative Change in Consensus 2026 EPS Estimates AI infrastructure stocks have seen 2026 earnings estimates jump 55% since December 2024, versus just 7% for the broader S&P 500. Strip them out and earnings fall 1%. The concentration risk is obvious. Image: Real Investment Advice

Global Market Implied Equity Risk Premiums

Global Market Implied Equity Risk Premiums With equity risk premiums squeezed in the U.S. and Japan, stocks are offering little extra return over bonds, making the trade harder to justify and raising the odds of investor disappointment. Image: Goldman Sachs Global Investment Research

Ownership of the U.S. Equity Market

Ownership of the U.S. Equity Market U.S. households hold 40% of the U.S. equity market. That sounds like broad ownership. In reality, nearly 90% of that stake is held by the wealthiest 10%. Image: Goldman Sachs Global Investment Research

Nasdaq 100 Index Contribution in Years of +10-25%

Nasdaq 100 Index Contribution in Years of +10-25% When the Nasdaq‑100 rises +10-25% in a year, the gains are usually driven by just three stocks. That is the nature of cap‑weighted indices. Narrow breadth isn’t a bug, it’s the engine. Image: Ned Davis Research

Consensus Hyperscaler Capex Estimates

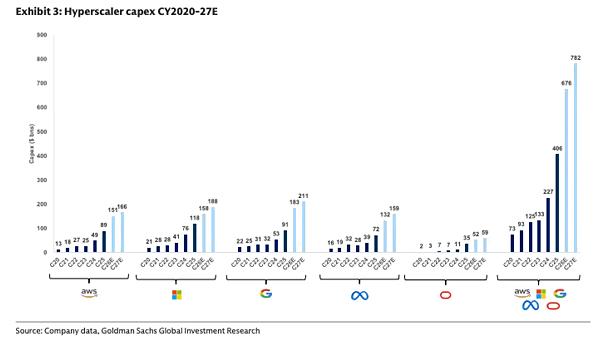
Consensus Hyperscaler Capex Estimates Capex estimates keep surprising to the upside as earnings season rolls on. Hyperscaler spending is now on track to hit over $1 trillion in 2027. That looks less like a cycle and more like a regime change. Image: Goldman Sachs Global Investment Research

U.S. ISM Manufacturing Index vs. S&P 500 EPS Annual % Change

U.S. ISM Manufacturing Index vs. S&P 500 EPS Annual % Change With the ISM Manufacturing Index and S&P 500 earnings growth moving hand in hand, either ISM climbs into the high 50s as the cycle heats up, or earnings estimates reset lower. At this point in the cycle, the revisions tend to come first. Image:…

Hyperscaler Year/Year Cash Spending Growth

Hyperscaler Year/Year Cash Spending Growth Hyperscalers are ramping up AI spending, leaving less capacity for buybacks and dividends. The trade-off is weaker near-term payouts in exchange for longer-term upside. Image: Goldman Sachs Global Investment Research

YoY Growth in S&P 500 Cash Use

YoY Growth in S&P 500 Cash Use S&P 500 companies are shifting cash to capex, led by AI, while buybacks stall. The result may be weaker EPS support and a thinner cushion for stock prices. Image: Goldman Sachs Global Investment Research

10-Year U.S. Treasury Yields vs. New Fed Chair

10-Year U.S. Treasury Yields vs. New Fed Chair 10-year U.S. Treasury yields often push higher in the first six months after a new Fed chair takes office, as markets adjust to a new policy regime. Leadership changes cloud the outlook, and markets price in that uncertainty. Image: TS Lombard

S&P 500 Performance After Six Week Wins Streaks Up >10%

S&P 500 Performance After Six Week Wins Streaks Up >10% Six weeks up and more than 10% higher. Historically, that combination has been a tailwind for U.S. stocks, delivering average 12-month returns of 17.1% since 1950. It is exactly the kind of setup bulls like to see. Image: Carson Investment Research