S&P 500 Returns During Earnings Seasons

S&P 500 Returns During Earnings Seasons During earnings season, the S&P 500 typically rallies, posting a median gain of 2% over the first four weeks. This time, the index is up nearly four times that pace. That’s definitely not a “normal” earnings season. Image: Deutsche Bank Asset Allocation

Performance vs. S&P 500 by Uses of Cash

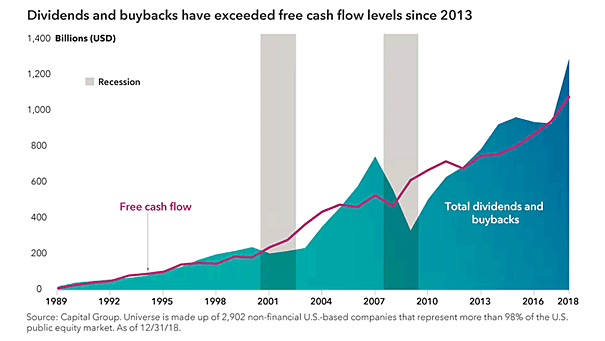
Performance vs. S&P 500 by Uses of Cash U.S. companies that return the most cash to shareholders through dividends and buybacks have outperformed the S&P 500 since 1992. The outperformance usually reflects stronger fundamentals and disciplined capital allocation. Image: Goldman Sachs Global Investment Research
Bitcoin and Software

Bitcoin and Software Bitcoin has largely tracked software stocks in recent years. The reset phase now looks to be transitioning into a rebound. Both have cleared near-term resistance and are starting to build short-term uptrends. Image: Topdown Charts

S&P 500 Earnings Growth – Consensus vs. Historical Norms

S&P 500 Earnings Growth – Consensus vs. Historical Norms Historically, S&P 500 earnings have risen 6.5% annually. The 18.6% call for 2026 is more than twice that rate, and forecasts for 2027 still around 16%. That kind of optimism tends to look compelling right up until it doesn’t. Image: Real Investment Advice

Magnificent Seven and S&P 500 ex Magnificent Seven Earnings Growth

Magnificent Seven and S&P 500 ex Magnificent Seven Earnings Growth After several quarters of narrowing performance between the Mag 7 and the S&P 493, the gap widened sharply again this quarter as the Mag 7 pulled decisively ahead. The concentration risk story isn’t going away anytime soon. Image: J.P. Morgan

S&P 500 Median Company EPS Growth

S&P 500 Median Company EPS Growth Earnings growth at the median S&P 500 company is running at 14%, its strongest pace in four years, helped by AI demand and more confident CEO guidance. Image: Deutsche Bank

S&P 500 Valuation – Shiller CAPE Ratio

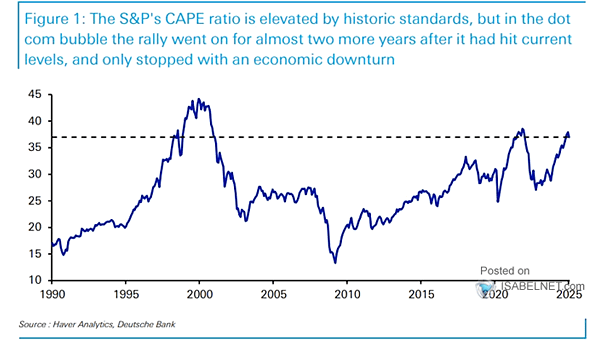
S&P 500 Valuation – Shiller CAPE Ratio Shiller CAPE puts U.S. stocks back in the stratosphere, great on the way up, unforgiving on the way down. From these levels, history argues for lower returns and higher risk. Not a great starting point if you care about future returns. Image: Topdown Charts

S&P 500 Returns – Strong vs. Weak Periods

S&P 500 Returns – Strong vs. Weak Periods U.S. stocks tend to lose some of their edge over the summer, with May to October often lagging the stronger November to April period. Even so, seasonality is a guide, not a guarantee. Image: Real Investment Advice

S&P 500 Quarterly Net Profit Margin (ex. Financials & Utilities)

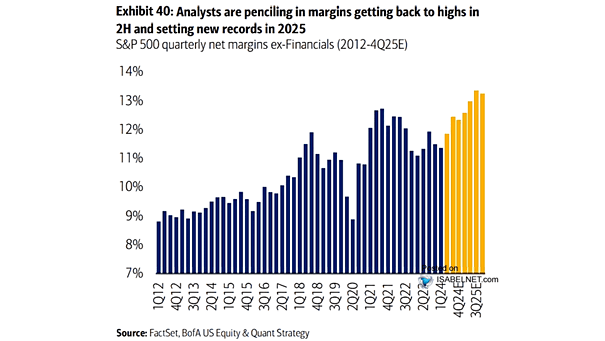
S&P 500 Quarterly Net Profit Margin (ex. Financials & Utilities) Corporate America is delivering solid profits, and with margins set to climb in the coming quarters, the bullish case keeps gaining traction. It’s getting harder to argue against that trend. Image: Goldman Sachs Global Investment Research
Share of S&P 500 Company Quarter-Ahead EPS Guidance Above Consensus Estimates

Share of S&P 500 Company Quarter-Ahead EPS Guidance Above Consensus Estimates Strong earnings and confident forecasts are keeping corporate America bullish on near-term profits, adding fuel to already rich valuations. As long as companies deliver, investors are willing to look past rich pricing. Image: Goldman Sachs Global Investment Research
Share of Global Market Capitalization

Share of Global Market Capitalization The U.S. accounts for just 4% of the world’s population, but it commands 63% of global equity value. Its innovation engine keeps pulling in foreign capital. Global markets, as ever, still move to an American beat. Image: Goldman Sachs Global Investment Research