U.S. Treasuries vs. Bond Volatility
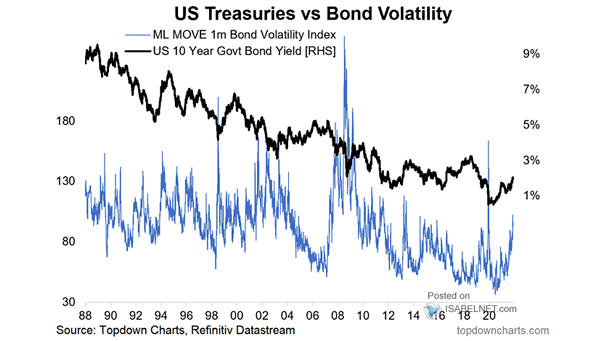
U.S. Treasuries vs. Bond Volatility Is it time to be bullish on U.S. Treasury bonds? Image: Topdown Charts
U.S. Treasuries vs. Bond Volatility Is it time to be bullish on U.S. Treasury bonds? Image: Topdown Charts
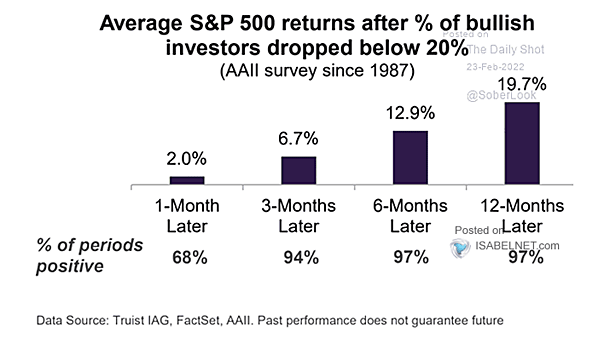
AAII Survey – Average S&P 500 Returns After % of Bullish Investors Dropped Below 20% The AAII Bullish Sentiment is below 20%, which is contrarian bullish. Image: Truist
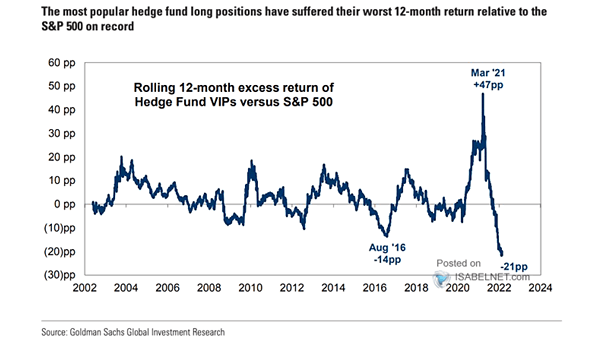
Rolling 6-Month Excess Return of Hedge Fund VIPs vs. S&P 500 The most popular hedge fund long positions have largely underperformed the broader market over the past 12 months. Image: Goldman Sachs Global Investment Research
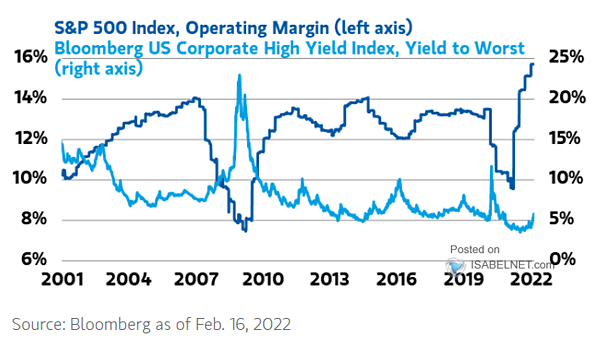
S&P 500 Index Operating Margin and U.S. Corporate High Yield Index High yield bonds may suggest a decline in corporate operating margins. Image: Morgan Stanley Wealth Management
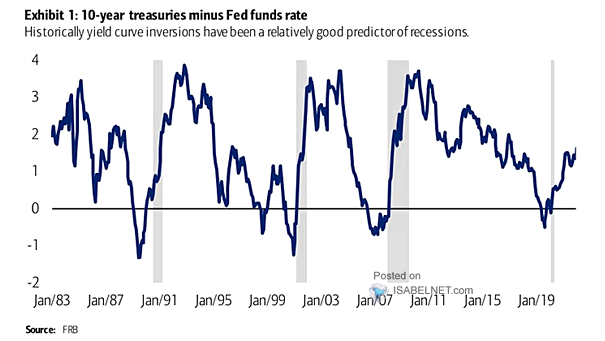
Recession – 10-Year U.S. Treasuries Minus Fed Funds Rate Historically, an inverted yield curve has been an excellent predictor of recessions in the United States. Image: BofA Global Research
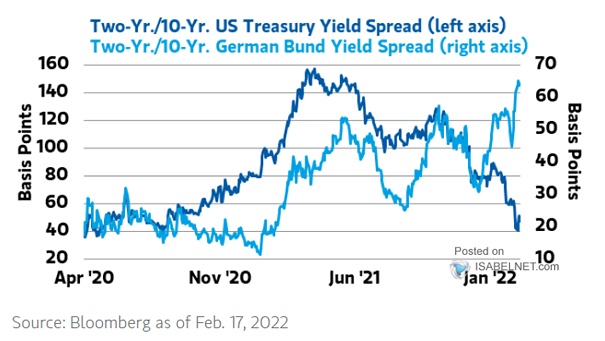
Yield Curve – 2Y/10Y U.S. Treasury Yield Spread and 2Y/10Y German Treasury Yield Spread The U.S. and German yield curves are decoupling, suggesting a slower economic activity in the United States. Image: Morgan Stanley Wealth Management
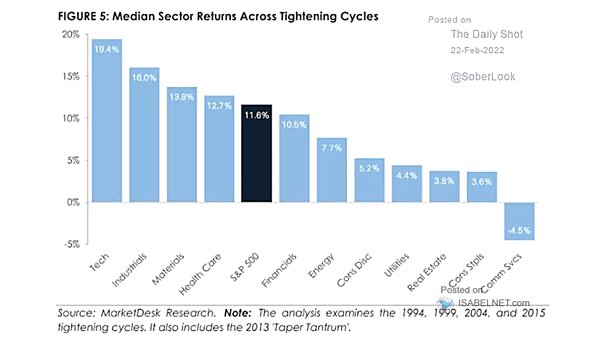
Median Sector Returns Across Tightening Cycles Historically, S&P 500 returns tend to be positive during tightening cycles. Image: MarketDesk Research
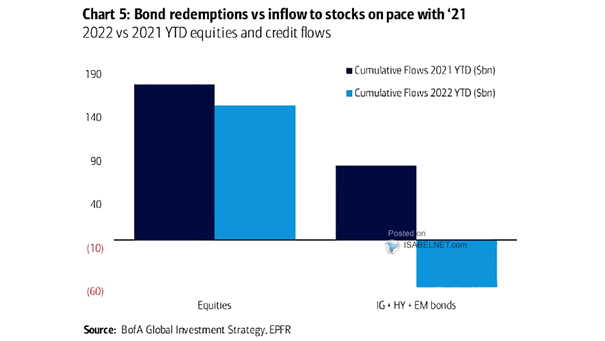
Equities and Credit Flows Flows into equities remain strong this year. Image: BofA Global Investment Strategy
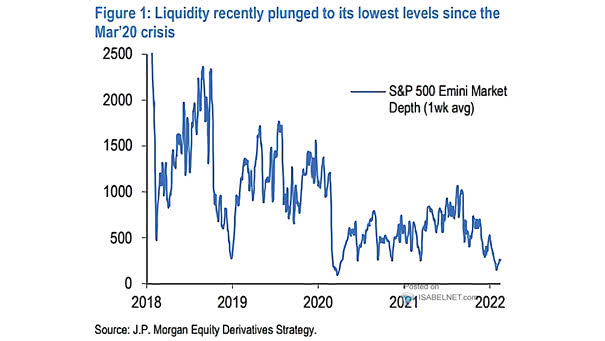
Liquidity – S&P 500 E-mini Futures Market Depth S&P 500 E-mini futures market liquidity remains below average levels. Image: J.P. Morgan Equity Derivatives Strategy
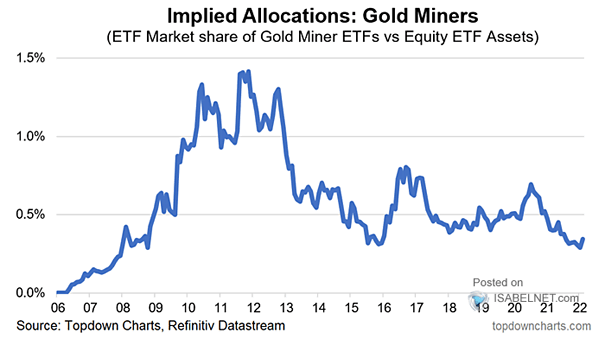
Implied Allocations: Gold Miners Allocation to gold miners remains low. Should investors be bullish on gold miners as valuations are reasonable? Image: Topdown Charts
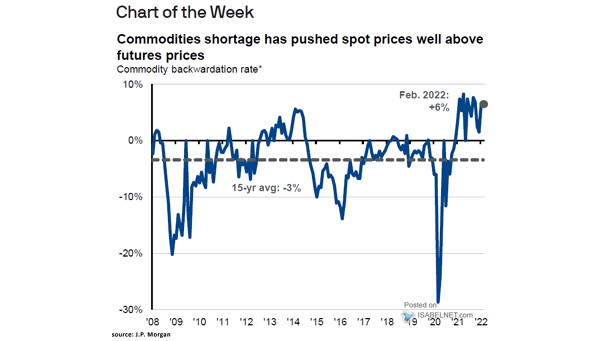
Commodities – Commodity Backwardation Rate Current commodity spot prices are higher than futures prices due to tight supply and strong demand. Image: J.P. Morgan Asset Management