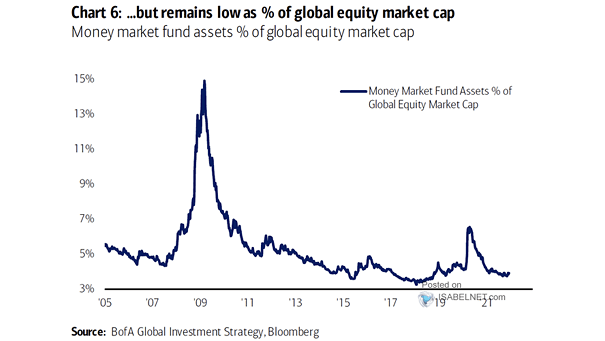
S&P 500 Index vs. Margin Debt
S&P 500 Index vs. Margin Debt Should investors be worried that the margin debt growth rate falls below 50%? Image: Lohman Econometrics
Gold vs. U.S. 10-Year Real Yields and U.S. Dollar Index – 3-Month Correlation of Weekly Return Generally, U.S. 10-year real yields and the U.S. dollar are negatively correlated with the price of gold. Image: Goldman Sachs Global Investment Research
U.S. GDP The slowdown in U.S. GDP is expected to be short-lived. Image: J.P. Morgan Asset Management
WTI Crude Oil Price Seasonality Seasonality suggests that oil prices tend to move lower into year end. Image: Topdown Charts
National Income vs. GDP and U.S. Recessions Fast rising compensation of employees tends to precede economic slowdowns in the United States. The U.S. economic recovery is expected to slow down in 2022. Image: Real Investment Advice
S&P 500 Real Earnings Yield Historically, negative real earnings yields tend to be bearish for U.S. stocks due to policy response. Image: BofA Global Investment Strategy
Estimated Net Retail Flow vs. S&P 500 Return Will retail investors keep buying the dip? Image: Morgan Stanley Quantitative and Derivative Strategies
Central Bank Asset Purchases The pace of global central bank purchases is expected to turn negative next year. Image: BofA Global Investment Strategy
S&P 500 vs. Fed Fund Rates and Real GDP Equity markets are vulnerable to tapering and rising rates. Could the Fed be making a policy mistake? Image: Real Investment Advice
Oil Prices and Consensus Capex Could oil capex cuts lead to supply disruptions? Image: Morgan Stanley Research
5-Year Rolling Correlation Between S&P 500 TTM EPS YoY vs. China Nominal GDP and U.S. Nominal GDP China’s economic growth slowdown suggests trouble ahead for the S&P 500. Image: BofA US Equity & Quant Strategy