2-Year Government Bond Yield Moves in Selected Countries
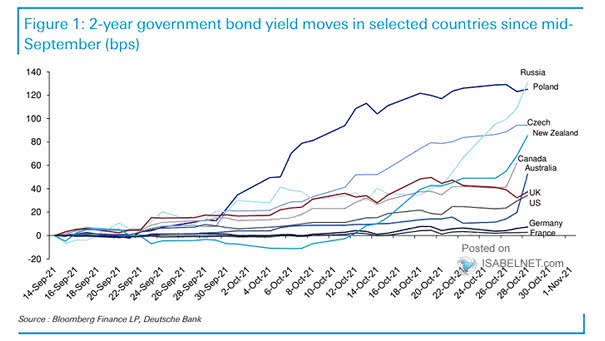
2-Year Government Bond Yield Moves in Selected Countries Bond traders expect monetary policy to tighten. Image: Deutsche Bank
2-Year Government Bond Yield Moves in Selected Countries Bond traders expect monetary policy to tighten. Image: Deutsche Bank
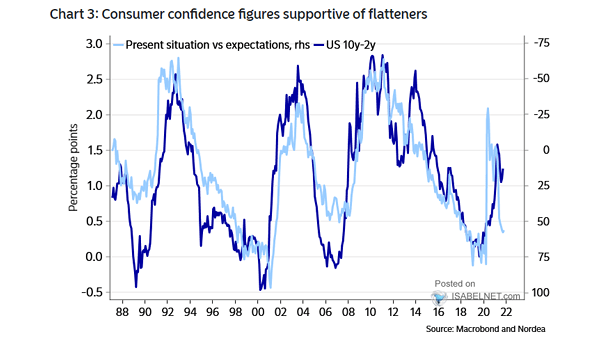
Consumer Confidence and U.S. 10Y-2Y Yield Curve Historically, the U.S. 10Y-2Y Treasury yield curve tends to follow U.S. consumer confidence. Image: Nordea and Macrobond
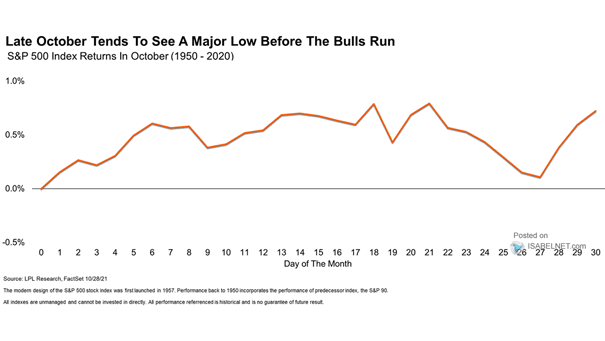
S&P 500 Index Returns in October Historically, the last week of October tends to be bullish for U.S. stocks. Image: LPL Research
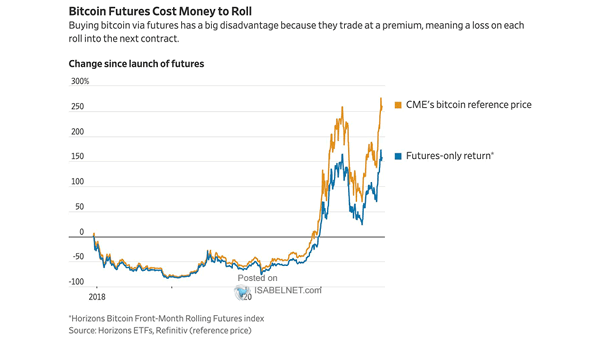
CME’s Bitcoin Reference Price vs. Futures Only Return Buying Bitcoin via futures could be costly for long-term investors. Image: The Wall Street Journal
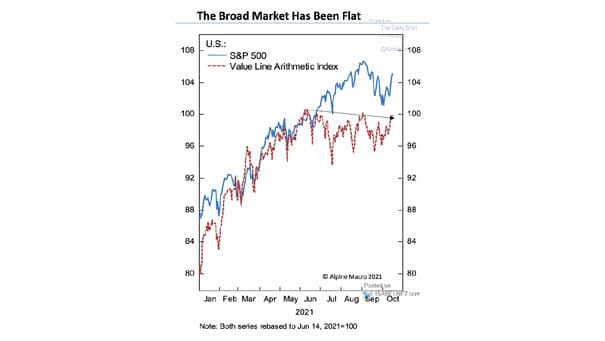
U.S. Equity Market – S&P 500 vs. Value Line Arithmetic Index The broad equity market has been flat, but is now starting to breakout. Image: Alpine Macro
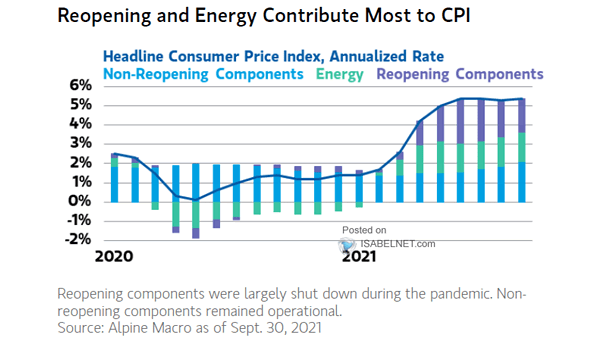
Inflation – Headline Consumer Price Index, Non-Reopening Components, Energy and Reopening Components Reopening and energy contribute the most to inflation. Image: Morgan Stanley Wealth Management
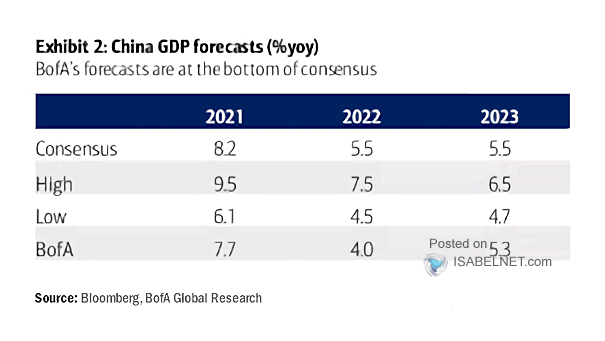
China GDP Forecasts BofA is more pessimistic than consensus and expects 2022 China GDP to grow at 4.0% Image: BofA Global Research
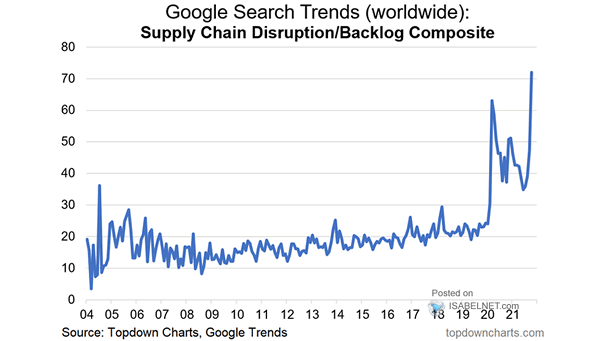
Inflation – Supply Chain Disruption/Backlog Composite Surging searches for supply chain disruption and backlogs could lead to inflation risks. Image: Topdown Charts
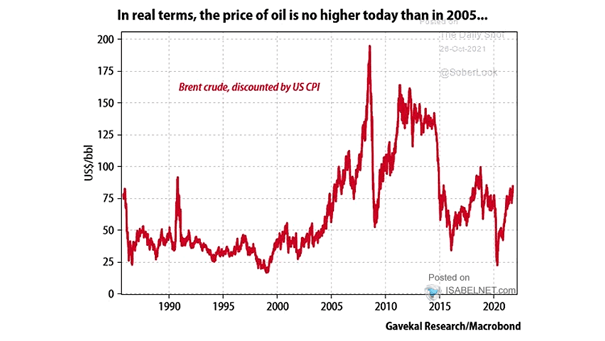
Brent Crude Oil Discounted by U.S. CPI The current level of oil prices in real terms is moderately high. Image: Gavekal, Macrobond
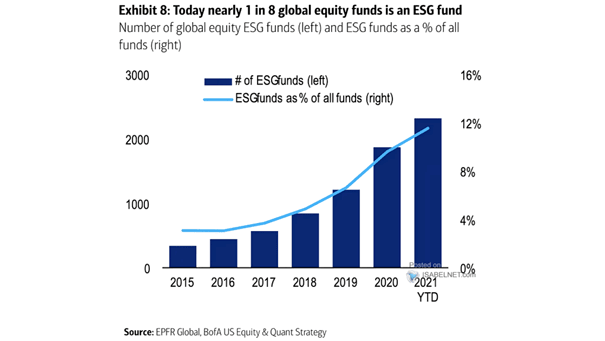
Number of Global Equity ESG Funds and ESG Funds as a % of All Funds ESG funds are booming and show no signs of slowing down. Image: BofA US Equity & Quant Strategy
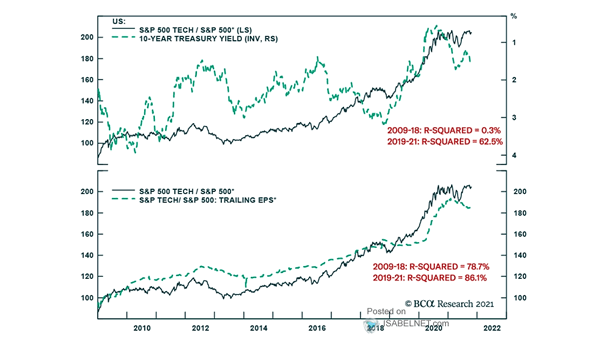
S&P 500 Tech / S&P 500 vs. U.S 10-Year Treasury Yield and Trailing EPS Will the outperformance of U.S. tech stocks continue? Image: BCA Research