Net EUR Positioning
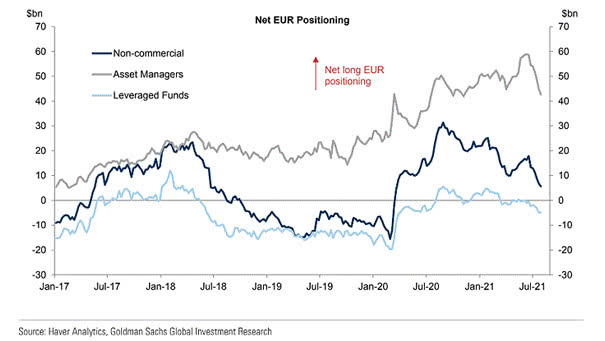
Net EUR Positioning Asset managers and non-commercial traders have decreased their net long positions in the euro. Image: Goldman Sachs Global Investment Research
Net EUR Positioning Asset managers and non-commercial traders have decreased their net long positions in the euro. Image: Goldman Sachs Global Investment Research
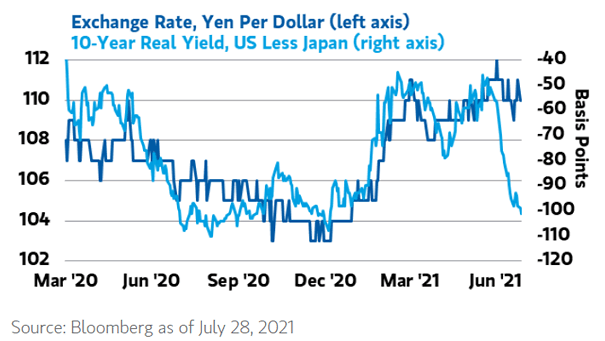
Exchange Rate, Yen Per Dollar and 10-Year Real Yield, U.S. Less Japan The disconnect in real rates extends to the currency market. Image: Morgan Stanley Wealth Management
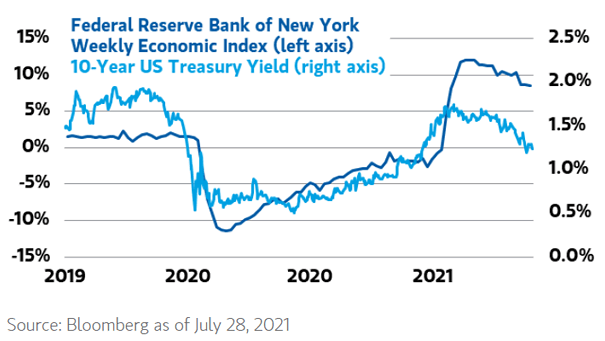
Federal Reserve Bank of New York Weekly Ecocomic Index and U.S. 10-Year Treasury Yield While the U.S. 10-year Treasury yield tends to follow the direction of macroeconomic indicators, it has decoupled from fundamentals. Image: Morgan Stanley Wealth Management
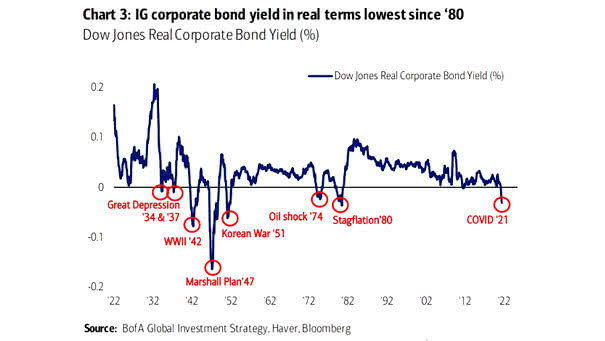
Dow Jones Real Corporate Bond Yield The real yield on IG corporate bonds is now at its lowest since 1980. Image: BofA Global Investment Strategy
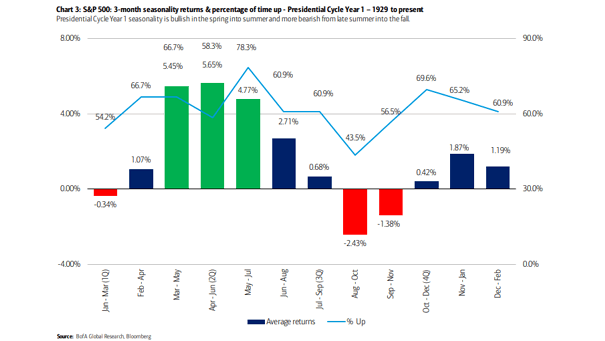
S&P 500 3-Month Seasonality Returns and Percentage of Time Up – Presidential Cycle Year 1 S&P 500 seasonality is more bearish in Presidential cycle year 1, from late summer into the fall. Image: BofA Global Research
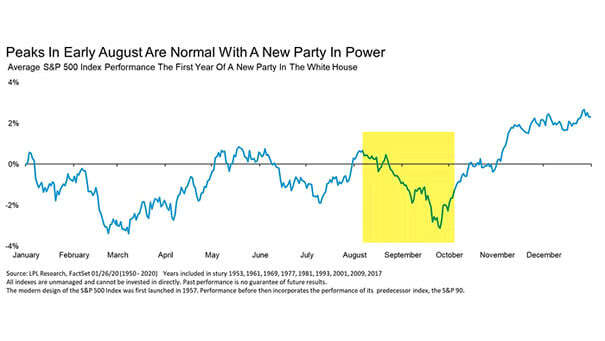
Average S&P 500 Index Performance the First Year of a New Party in the White House When a new party is in power in the White House, market weakness is expected in August and September. Image: LPL Research
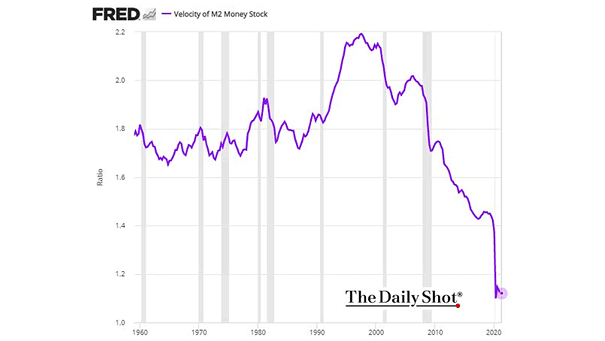
Velocity of M2 Money Stock in the U.S. Is there really an inflation threat? The surge in M2 money growth has coincided with a collapse in M2 velocity. Image: The Daily Shot
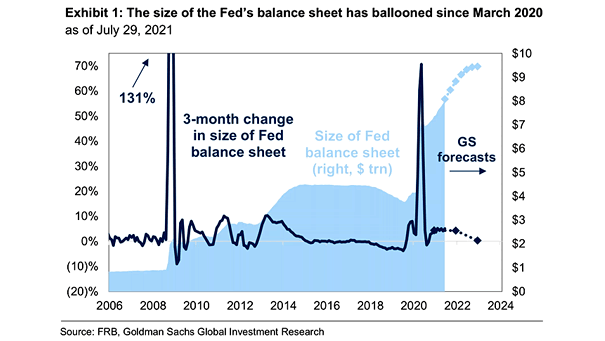
3-Month Change in Size of Fed Balance Sheet The Fed’s bank balance sheet has expanded considerably during the coronavirus pandemic. Image: Goldman Sachs Global Investment Research
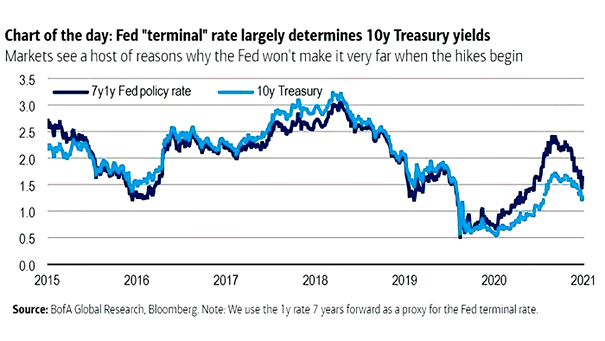
7y1y Fed Policy Rate and U.S. 10-Year Treasury Yield BofA still expects U.S. 10-year rates to reach 1.9% by the end of the year, but downside risks have increased. Image: BofA Global Research
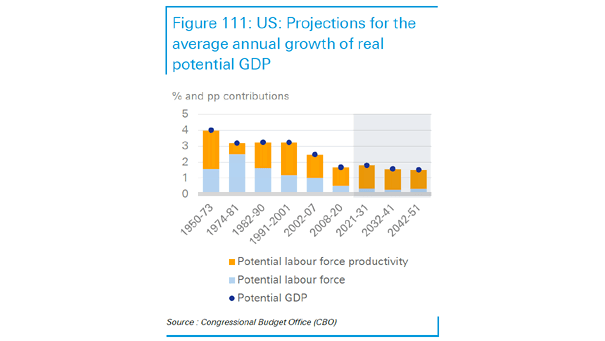
U.S. Real Potential GDP U.S. real potential GDP growth is expected to fall to 1.5% from 1.7% today, due to ageing population. Image: Deutsche Bank
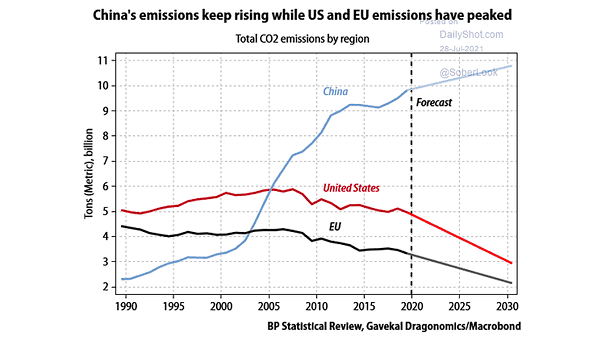
China – Total CO2 Emissions by Region China’s CO2 emissions continue to rise. Will China be carbon neutral by 2060? Image: Gavekal, Macrobond