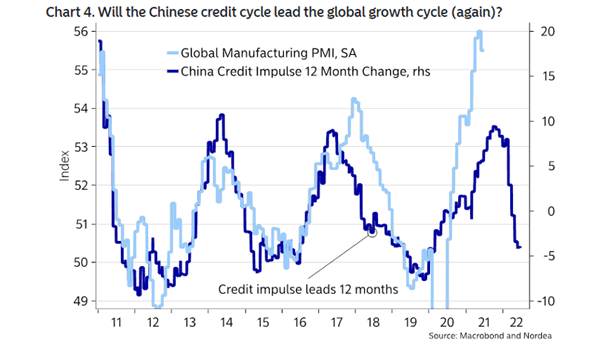
Valuation – U.S. 10-Year Real Yields and MSCI World N12M PE (Inverted)
Valuation – U.S. 10-Year Real Yields and MSCI World N12M PE (Inverted) If U.S. real yields rise, the price of global equities is expected to fall. Image: Morgan Stanley Research
S&P 500 “Fair Values” According to ISM Levels If the ISM drops to 50 by the end of 2021, the “fair value” of the S&P 500 would be 3730. Image: Nordea and Macrobond
US$ Gold vs. U.S. Dollar Index Generally, when the U.S. dollar falls, gold tends to rise. Image: Morgan Stanley Research
% of Potential GDP and Federal Deficit + Balance Sheet Expansion Will the U.S. economy slow down much more in 2022 than people think? Image: Quill Intelligence, LLC
S&P 500 Index Performance After The First Fed Rate Hike Historically, the S&P 500 Index tends to do well after the first Fed rate hike. Image: LPL Research
S&P 500 Index – Equal Weight vs. Pure Value vs. Pure Growth Is the value trade far from over? Image: Morgan Stanley Wealth Management
Annual Equity Flows % of AUM Equity inflows as a percentage of AUM are very strong year-to-date. Image: BofA Global Investment Strategy
Real Estate Stocks – Weekly Real Estate Flows Could real estate stocks present opportunities? Image: BofA Securities
MSCI World Value vs. Growth Relative Index and U.S. 10-Year Real Yields Value tends to outperform growth as U.S. real rates rise (R² = 0.93). Image: Morgan Stanley Research
U.S. Fiscal Effects of Enacted and Proposed Legislation U.S. fiscal support is boosting growth at the cost of increased debt. Image: Goldman Sachs Global Investment Research
Risky Assets and Fed Balance Sheet (M1) Growth Should investors be worried about the Fed’s balance sheet growth? Image: Morgan Stanley Research