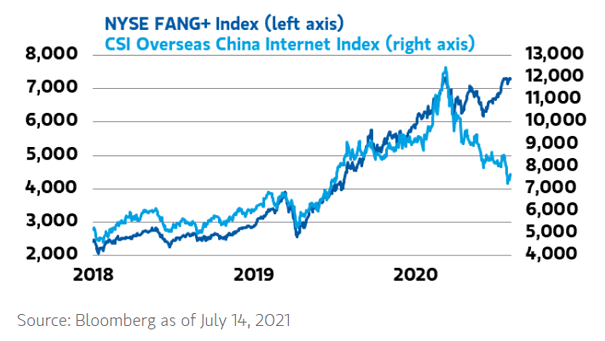
M1 Money Supply Growth YoY
M1 Money Supply Growth YoY The M1 money supply in the United States has grown faster than any time in history. Image: Gavekal, Macrobond
S&P 500 Total Number of Employees to Total Revenues Ratio In 1986, it took 8 employees to generate US$1 million in revenue. Today, the S&P 500 is 70% less labor intensive than it was in the 80s. Image: BofA Global Research
Inflation – Annualized 3-Month Headline CPI Change Has U.S. headline inflation peaked? Image: BofA Global Investment Strategy
Inflation – Annualized 3-Month Core CPI Change Has U.S. core inflation peaked? Image: BofA Global Investment Strategy
Valuation – FY2 P/E Premium of Growth vs. Value The valuation spread between Growth and Value is still well above its long-term average. Image: Goldman Sachs Global Investment Research
MOVE Index vs. U.S. 10Y-2Y Yield Curve Should investors expect a steeper yield curve and more fixed-income volatility? Image: Variant Perception Research
Flows – Broad Commodity ETFs Flows into broad commodity ETFs are massive this year. Image: Arbor Research & Trading LLC
Real 10-Year U.S. Treasury Yield Has the real 10-year U.S. Treasury yield bottomed out? Image: Deutsche Bank
Returns After Long Streaks Without A New High, Yet Within 1% Of A New High Whole Time Experienced stock traders tend to never short a dull market. Image: LPL Research
U.S. Net International Investment Position (NIIP) as a Share of GDP Is the U.S. net international investment position (NIIP) a cause of concern? Image: Gavekal, Macrobond
Sentiment – Global Risk Appetite Index The global risk appetite index remains positive, but is drifting down. Image: Credit Suisse Research