Earnings Growth

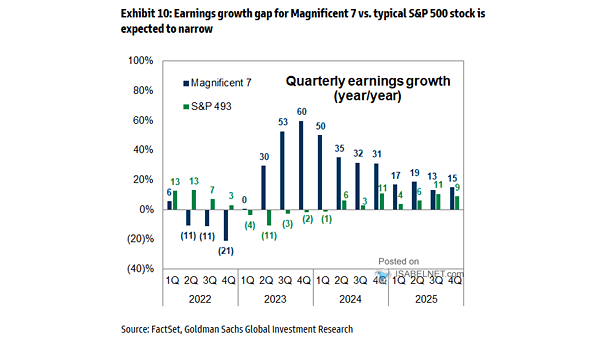
Earnings Growth The gap between the Magnificent Seven and the rest of the S&P 500 is expected to narrow, paving the way for a broader, more balanced earnings landscape across the index in 2026 and 2027. Image: Goldman Sachs Global Investment Research

U.S. Current Account Balance as a % of GDP

U.S. Current Account Balance as a % of GDP The U.S. current account deficit has been on a widening path since 2019 and looks poised to stay elevated into 2026. Image: Gavekal, Macrobond

Hyperscaler Capex

Hyperscaler Capex Hyperscalers are on pace to spend $4 trillion on capex by 2030, more than ten times what the Apollo program cost in today’s dollars, a bet that leaves little room for error. Image: Bloomberg

S&P 500 Average Return in December

S&P 500 Average Return in December With the holidays in sight, buyers are starting to reappear. History shows U.S. stocks often find a floor around mid-December and rally into year-end, a seasonal lift the bulls never seem to tire of. Image: Carson Investment Research

Valuation – Shiller CAPE Ratio for the S&P 500

Valuation – Shiller CAPE Ratio for the S&P 500 The Shiller CAPE has pushed above 40, approaching the 44-times peak seen at the height of the dot-com frenzy. Such rich valuations have often signaled markets running hot. Image: Deutsche Bank Research

Gold vs. 1970s

Gold vs. 1970s Gold has been shining bright, but it’s nowhere near the late-1970s gold rush. Investors might want to keep an open mind. Image: Bloomberg

Seasonality – S&P 500 Index Returns in December

Seasonality – S&P 500 Index Returns in December As the holidays approach, buyers usually return and the year-end rally tends to pick up speed in the second half of December. Historically, U.S. stocks have climbed an average of 1.4% during the month. Image: Carson Investment Research

Index Performance – S&P 500, Nasdaq 100, Russell 2000, Mag 7

Index Performance – S&P 500, Nasdaq 100, Russell 2000, Mag 7 The broad market is quietly rotating: the S&P 500 is just below its October highs, but small caps and the average stock are outperforming, while mega-cap growth and Tech soften. Image: Deutsche Bank Asset Allocation

S&P 500 Trend Channel

S&P 500 Trend Channel Valuations may look stretched, but the S&P 500 has held a steady 22.7% annualized uptrend since October 2022 and now sits near the bottom of that trend channel. Image: Deutsche Bank Asset Allocation

S&P 500 Valuation Multiples

S&P 500 Valuation Multiples With valuations lofty and expectations running high, U.S. stocks look exposed if earnings or the economy disappoint. Image: Real Investment Advice