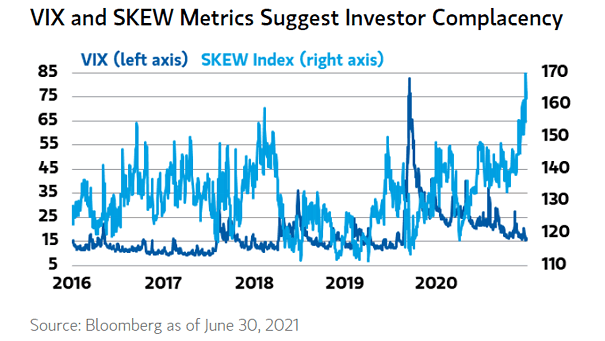
U.S. Business Cycle Indicator in Repair Phase
U.S. Business Cycle Indicator in Repair Phase Morgan Stanley’s cyclical indicator remains in the “repair” phase. Image: Morgan Stanley Research
Government Bond (7-10 Year) Total Return in US$ Since 2008 Will Chinese bonds continue to outperform? Image: Gavekal, Macrobond
Major Central Bank Balance Sheets vs. Total Value of Global Stock and Bond Markets Are central banks creating bubbles? Image: Lohman Econometrics
Inflation – U.S. 10-Year Yield and Core CPI Is the rise of inflation temporary, as bond yields are low given current core CPI? Image: Nordea and Macrobond
Inflation in OECD Economies and Decade Averages Should investors worry about inflation coming back? Image: Financial Times
Coronavirus – COVID-19 “Lockdown Portfolio” vs. COVID-19 “Reopening Portfolio” A perfect V-shaped recovery for the reopening portfolio vs. lockdown portfolio. Image: BofA Global Investment Strategy
Housing – U.S. Existing Home Sales: Median Price and Inventory The inventory of homes for sale in the U.S. is now very low, with home prices expected to keep climbing. Image: Morgan Stanley Wealth Management
S&P 500 Total Return vs. “Sell in May” Is “Sell in May and Go Away” a myth? Image: Financial Times
China Credit Impulse and U.S. 10-Year Treasury Yield (Leading Indicator) China’s credit impulse tends to lead the U.S. 10-year Treasury yield by one year. Lower Treasury yields ahead? Image: Alpine Macro
Fed MBS Holdings and FHFA House Price Index Despite a strong U.S. housing market, the Federal Reserve continues to buy mortgage-backed securities (MBS). Image: BofA Global Investment Strategy
Valuation – CAPE Ratio and Subsequent 10-Year Average Annualized Returns The current CAPE ratio at 37.04 suggests anemic returns over the next 10 years for U.S. equities. Image: Jeroen Blokland