Productivity Growth in the U.S.
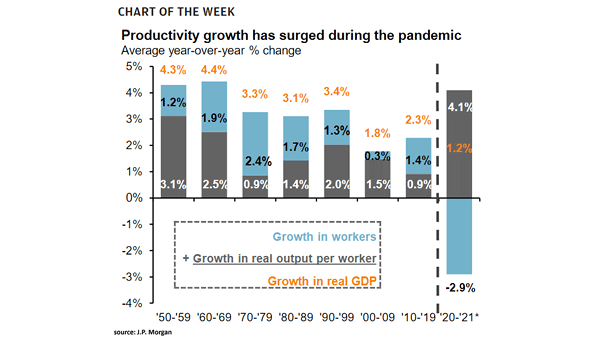
Productivity Growth in the U.S. The coronavirus pandemic has boosted productivity in the United States and helps explain some of the strong gains in the stock market. Image: J.P. Morgan Asset Management
Productivity Growth in the U.S. The coronavirus pandemic has boosted productivity in the United States and helps explain some of the strong gains in the stock market. Image: J.P. Morgan Asset Management
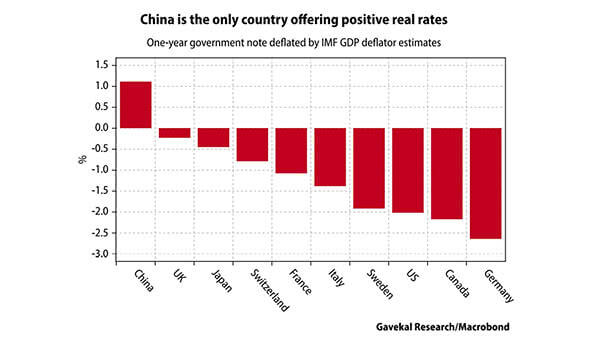
Negative Real Rates Around the World Most economies in the world experience negative real rates. Image: Gavekal, Macrobond
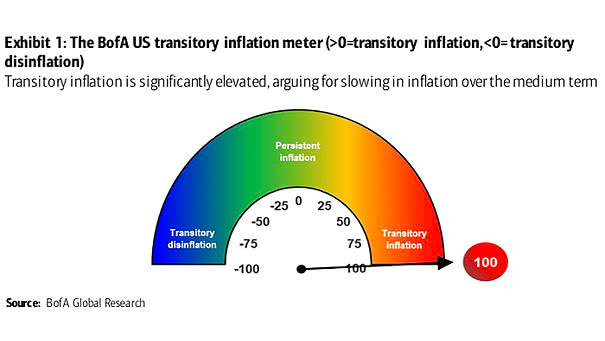
U.S. Transitory Inflation Meter Is U.S. inflation transitory? The BofA US transitory inflation meter remains at 100. BofA expects core PCE inflation will settle down to 2.1% by the end of 2022. Image: BofA Global Research
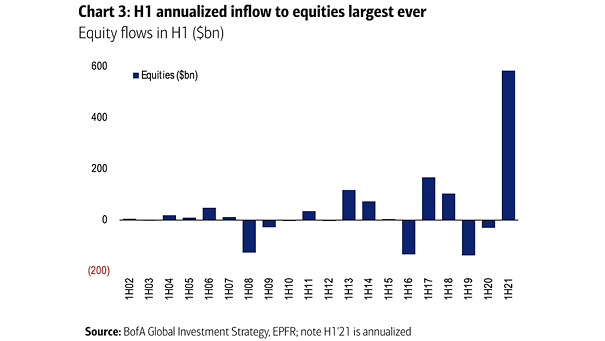
Equity Flows in H1 Could too much liquidity create market instability? Image: BofA Global Investment Strategy
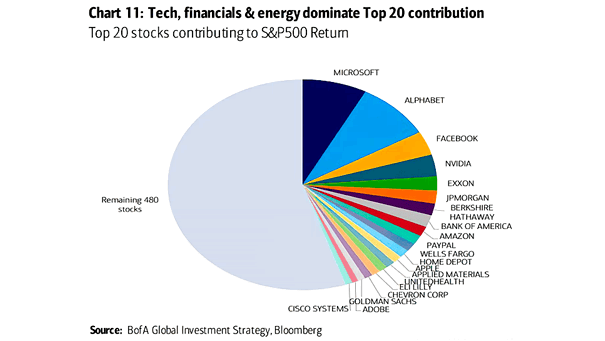
Top 20 Stocks Contributing to S&P 500 Return The S&P 500 remains overly concentrated. Is this a cause for concern? Image: BofA Global Investment Strategy
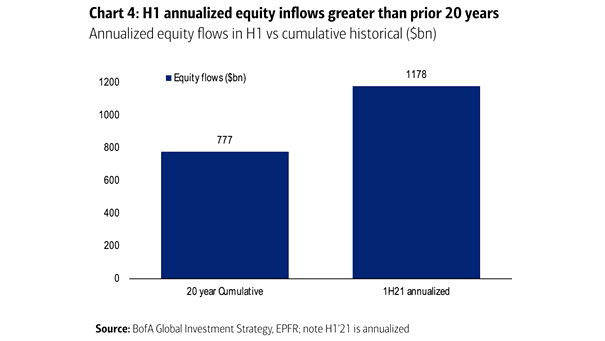
Annualized Equity Flows in H1 vs. Cumulative Historical Are equity inflows headed to the moon? Image: BofA Global Investment Strategy
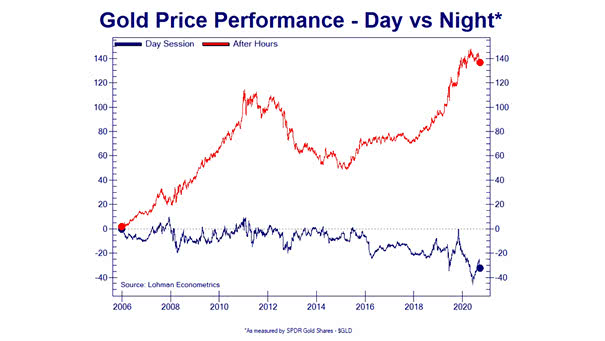
Gold Price Performance – Day vs. Night Like the S&P 500, Gold also loves the night. Since 2006, the real profits have been made outside regular trading hours. Image: Lohman Econometrics
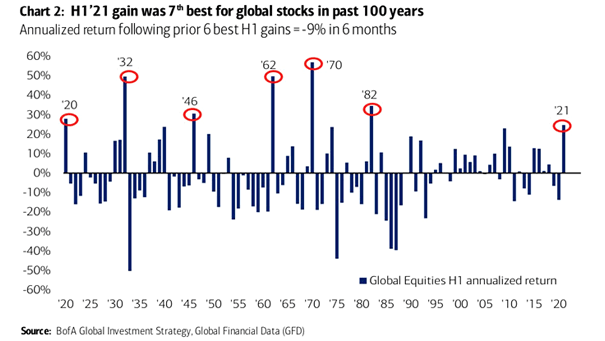
Global Stocks – Annualized Return Following Prior 6 Best H1 Gains How will global stocks perform for the rest of the year? Image: BofA Global Research
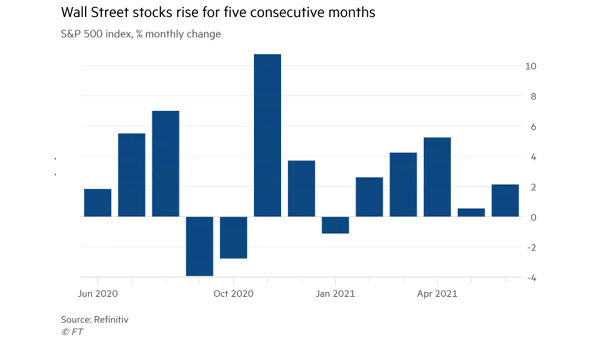
S&P 500 Index – % Monthly Change Historically, if the S&P 500 Index is up more than 12.5% in the first 6 months of the year, as it is today, it tends to be bullish through the rest of the year. Image: Financial Times
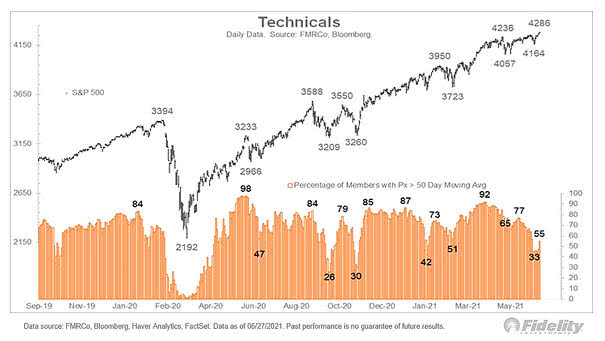
S&P 500 Market Breadth – % of Members Above 50-Day Moving Average Market breadth has improved somewhat. 55% of S&P 500 stocks are now trading above their 50-day moving average. Image: Fidelity Investments
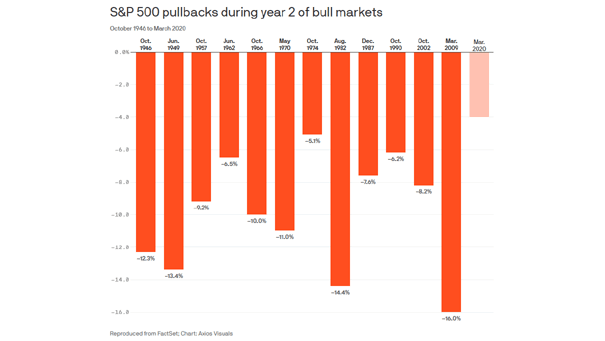
S&P 500 Pullbacks During Year Two of Bull Markets Should investors wait for a pullback as an opportunity to invest in U.S. stocks? Image: Axios