Advanced Economies – Household Sector Credit To GDP
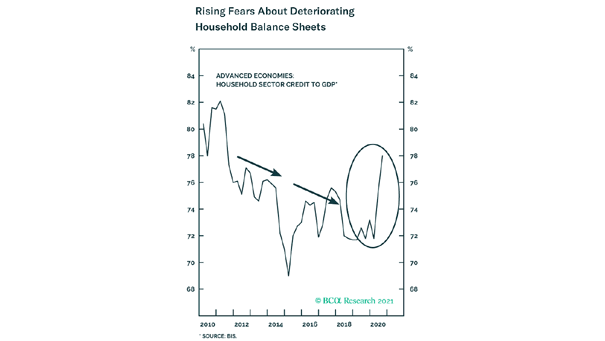
Advanced Economies – Household Sector Credit To GDP Are household balance sheets a potential source of risk? Image: BCA Research
Advanced Economies – Household Sector Credit To GDP Are household balance sheets a potential source of risk? Image: BCA Research
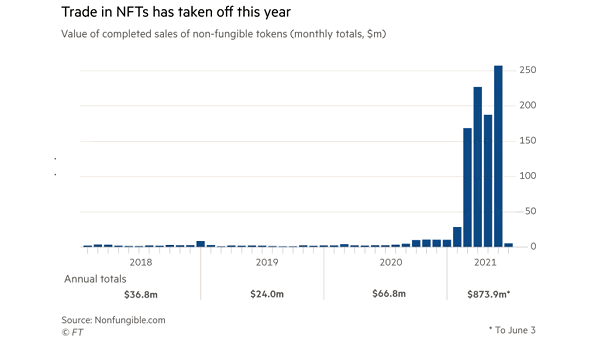
Market – Value of Completed Sales of Non-Fungible Tokens (NFTs) NFTs are booming this year. Is digital art the next bubble? Image: Financial Times
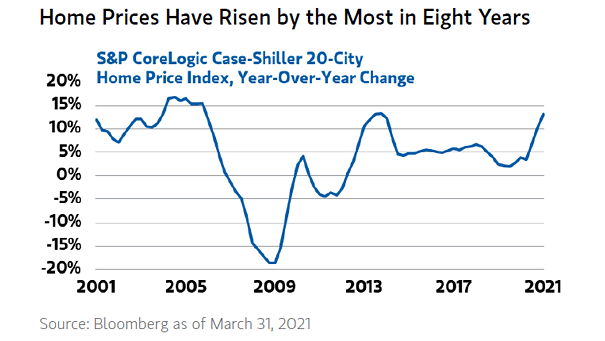
Housing – U.S. Home Prices U.S. home prices have risen significantly during the pandemic, but are expected to rise more slowly in the coming years. Image: Morgan Stanley Wealth Management
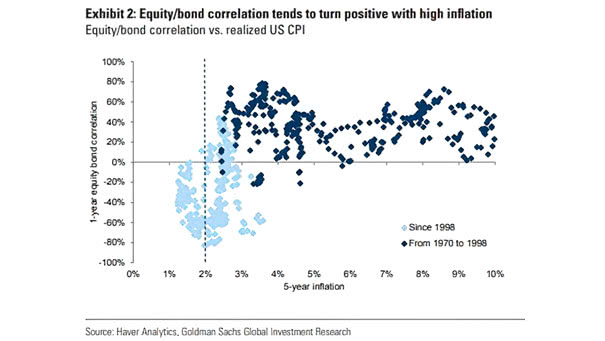
Inflation and Equity/Bond Correlation Investors are watching inflation very closely. When inflation is high, the equity/bond correlation tends to turn positive. Image: Goldman Sachs Global Investment Research
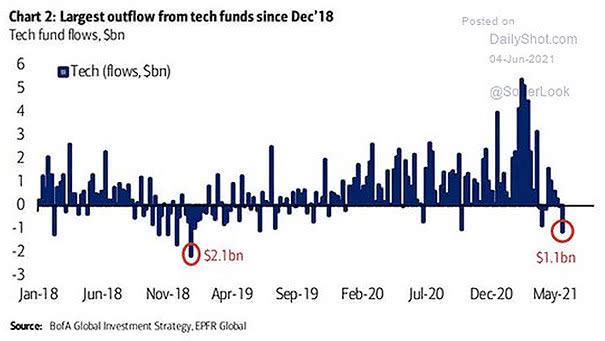
Tech Equity Fund Flows Tech stocks saw their largest outflow since December 2018. Should investors dump tech stocks in favor of cyclicals? Image: BofA Global Investment Strategy
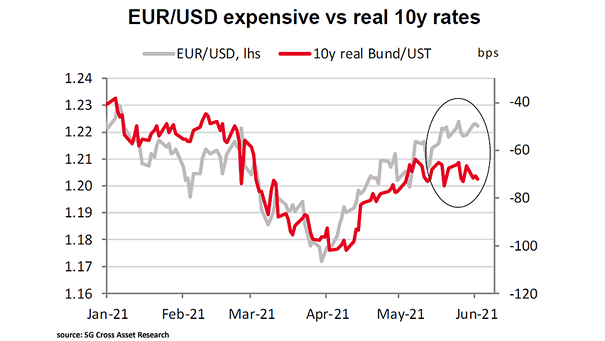
Euro to U.S. Dollar (EUR/USD) and 10-Year Bund/UST EUR/USD looks expensive vs. real 10-year rate differentials. Image: Societe Generale Cross Asset Research
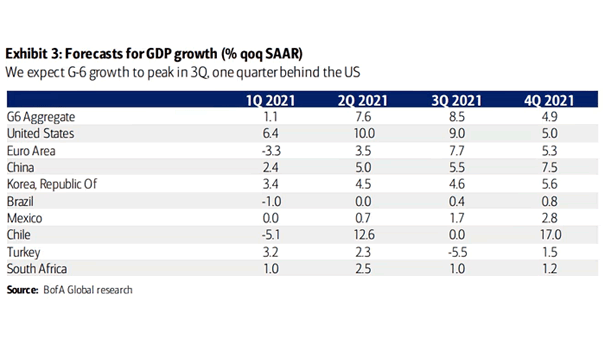
Forecasts for GDP Growth U.S. GDP growth is expected to peak this quarter. Image: BofA Global Research
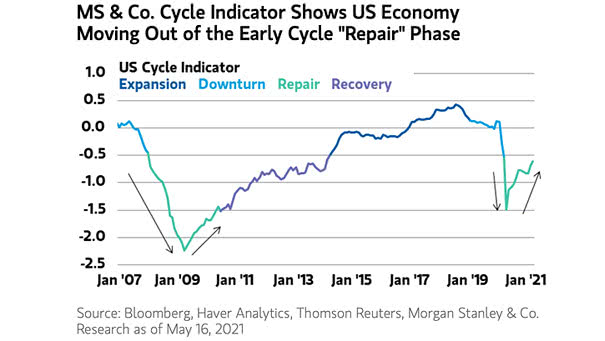
U.S. Business Cycle Indicator in Repair Phase Morgan Stanley’s cyclical indicator remains in the “repair” phase. Image: Morgan Stanley Research
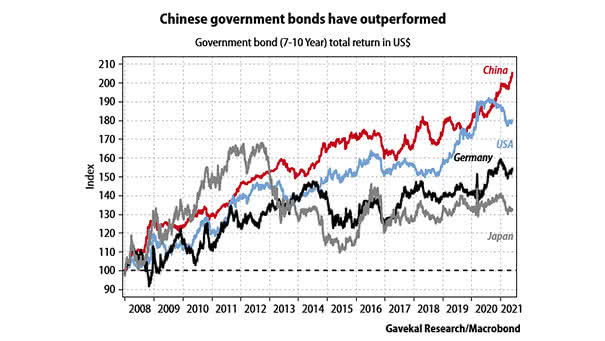
Government Bond (7-10 Year) Total Return in US$ Since 2008 Will Chinese bonds continue to outperform? Image: Gavekal, Macrobond
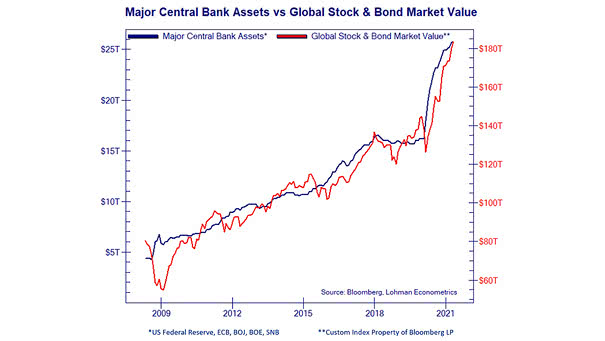
Major Central Bank Balance Sheets vs. Total Value of Global Stock and Bond Markets Are central banks creating bubbles? Image: Lohman Econometrics
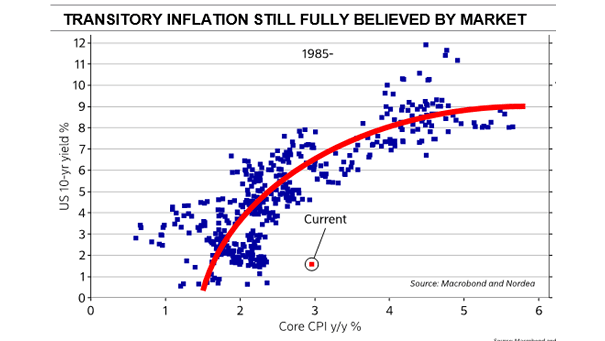
Inflation – U.S. 10-Year Yield and Core CPI Is the rise of inflation temporary, as bond yields are low given current core CPI? Image: Nordea and Macrobond