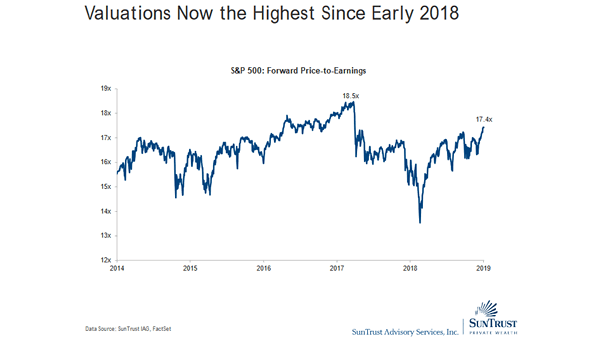
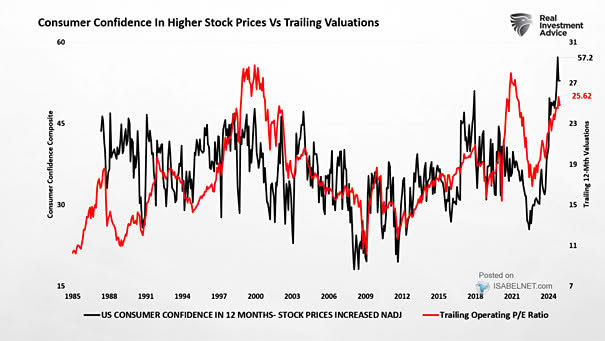
S&P 500 Index Returns vs. Drawdowns in Midterm Election Years

S&P 500 Index Returns vs. Drawdowns in Midterm Election Years Midterm years often test Wall Street’s nerve. Since 1930, the S&P 500 has typically fallen around 20% on average at some point, but those pullbacks have often marked the start of strong buying opportunities. Image: Ned Davis Research

Valuations Across EM Markets

Valuations Across EM Markets The valuation gap in emerging markets is striking: India trades at a premium, whereas China’s pricing feels more in line with its history. Image: Goldman Sachs Global Investment Research

Macro Valuation Measure (S&P 500)

Macro Valuation Measure (S&P 500) U.S. stocks look rich compared with what today’s macro backdrop would normally justify. In previous cycles, such lofty valuations at these levels have often paved the way for years of subdued returns. Image: Goldman Sachs Global Investment Research

Average Percentile of Sentiment Indicators

Average Percentile of Sentiment Indicators The mood is bullish for now, and we’re not near the extremes. Market participants aren’t showing signs of fatigue just yet, at least until the next headline hits. Image: Goldman Sachs Global Investment Research

Margin Debt as Percentage of Real Disposal Personal Income

Margin Debt as Percentage of Real Disposal Personal Income Margin debt sits at a record share of real disposable income. With incomes stagnating and borrowing surging, investors look vulnerable. Markets appear calm, for now, but they can turn fast. Image: Real Investment Advice

S&P 500 Aggregate vs Median Earnings Growth

S&P 500 Aggregate vs Median Earnings Growth S&P 500 earnings rose 14.5% year-on-year in Q4 2025, exceeding initial estimates and marking the strongest quarterly gain in four years as profit growth broadened across sectors. Image: Deutsche Bank

Valuation Percentile for Equity, Credit and Bond

Valuation Percentile for Equity, Credit and Bond Valuations matter more over the medium term than in the moment. In years like 2025, robust growth let markets climb anyway, powered by rising profits despite high price tags. Image: Goldman Sachs Global Investment Research

Global Sector Fund Flows Excluding Tech

Global Sector Fund Flows Excluding Tech Sector funds outside Tech have drawn a record $62 billion in inflows over the first five weeks of the year, more than the total for all of 2025. The rush shows investors are widening their bets beyond the usual tech favorites. Image: Deutsche Bank Asset Allocation

S&P 500 Earnings Revision Breadth

S&P 500 Earnings Revision Breadth The relationship isn’t perfect, but S&P 500 EPS revision breadth has often led market moves, showing a strong historical link with the index’s six‑month trailing returns. Image: Goldman Sachs Global Investment Research

Valuation – S&P 500 Shiller Cyclically-Adjusted P/E Ratio vs. Model-Predicted P/E Ratio

Valuation – S&P 500 Shiller Cyclically-Adjusted P/E Ratio vs. Model-Predicted P/E Ratio U.S. equities look expensive relative to both their own history and what today’s macro backdrop would normally justify. In past cycles, such stretches of pricey valuations have often been followed by years of subpar returns. Image: Goldman Sachs Global Investment Research