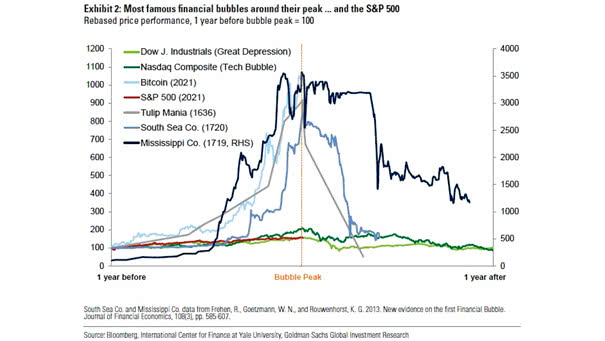
Most Famous Financial Bubbles Around their Peak and the S&P 500
Most Famous Financial Bubbles Around their Peak and the S&P 500 Is Bitcoin in a bubble disconnected from reality? Image: Goldman Sachs Global Investment Research
Most Famous Financial Bubbles Around their Peak and the S&P 500 Is Bitcoin in a bubble disconnected from reality? Image: Goldman Sachs Global Investment Research
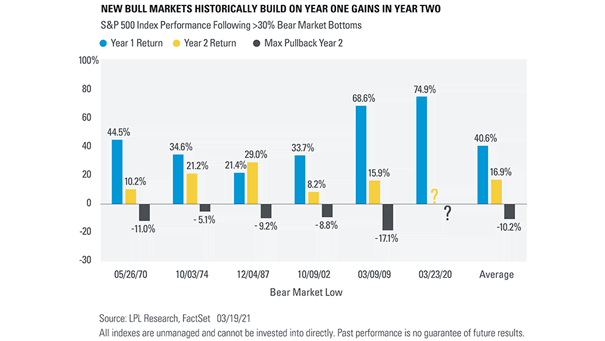
Bull Market – S&P 500 Index Performance Following >30% Bear Market Bottoms Historically, the S&P 500 has been up the second year of a new bull market every single time. Image: LPL Research
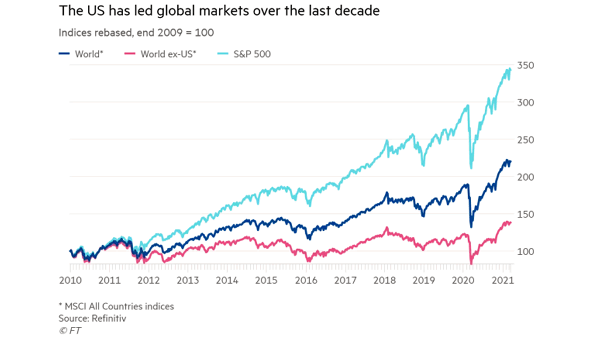
Performance – S&P 500 vs. MSCI World vs. MSCI World Ex-US Can the S&P 500 continue to outperform global equity markets over the next 10 years? Image: Financial Times
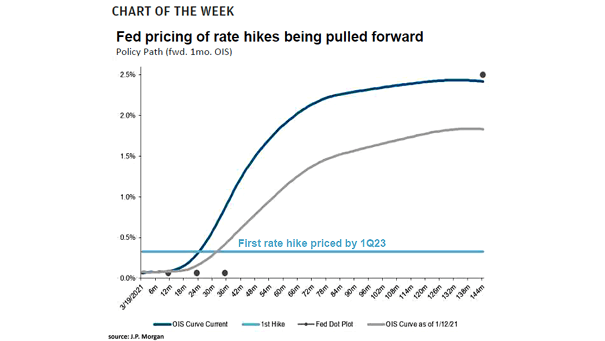
Interest Rates – Fed Rate Hike Markets are now pricing in at least one rate hike in the first quarter of 2023, based on expectations for higher inflation and strong growth. Image: J.P. Morgan Asset Management
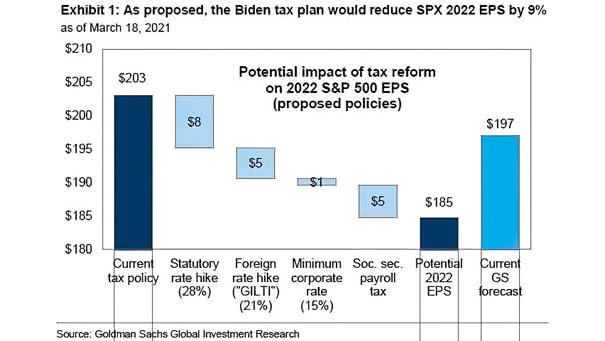
Potential Impact of Tax Reform on 2022 S&P 500 EPS A full implementation of the Biden tax plan would reduce S&P 500 EPS by 9%. Image: Goldman Sachs Global Investment Research
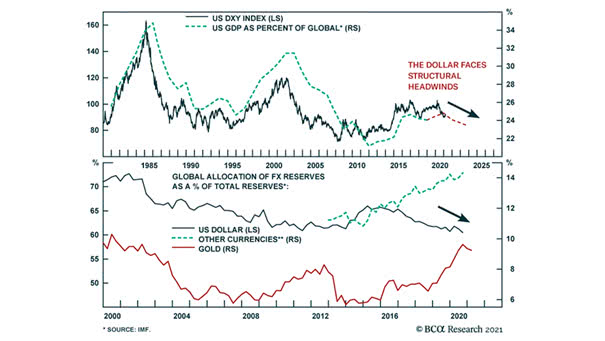
U.S. Dollar Index (DXY) and U.S. GDP as Percent of Global GDP Should investors expect the U.S. dollar to depreciate further over the next few years? Image: BCA Research
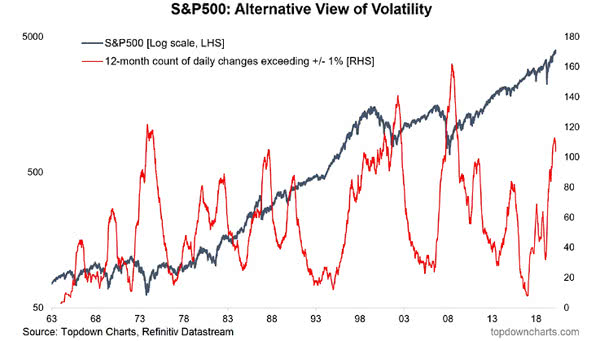
Volatility – S&P 500 and 12-Month Count of Daily Changes Exceeding +/- 1% The current stock market looks a lot like the dot-com bubble, as it shows the same pattern of rising stocks and volatility. Image: Topdown Charts
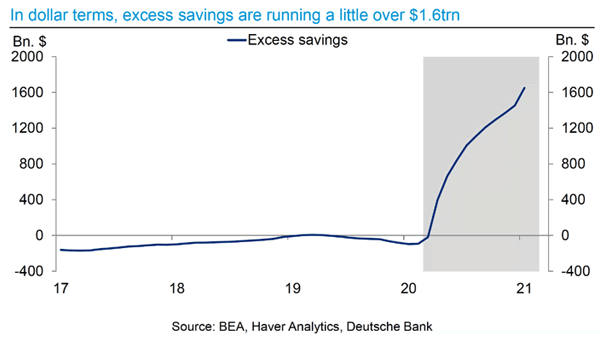
U.S. Excess Savings Could excess savings drive the U.S. stock market higher? Image: Deutsche Bank
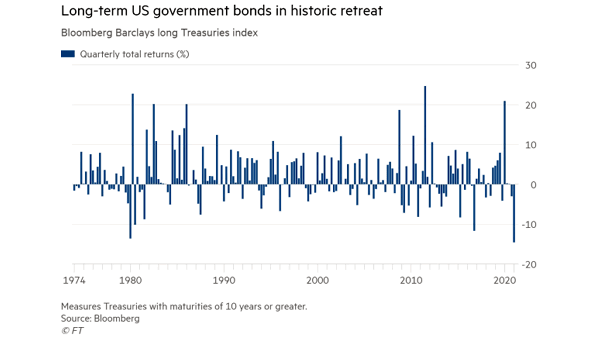
Long-Term U.S. Government Bond Quarterly Total Returns With low interest rates and inflation on the horizon, is Warren Buffett right to be bearish on bonds? Image: Financial Times
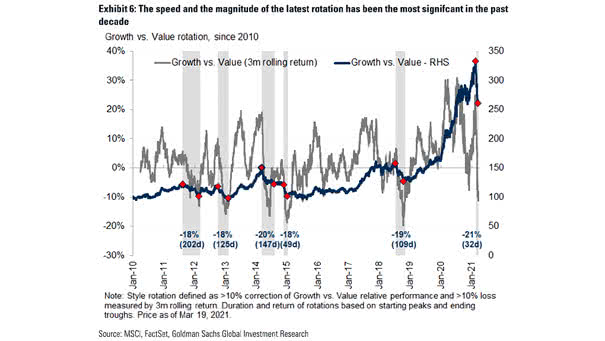
Growth vs. Value Rotation The latest rotation has been the most significant since 2010. But will Value still falter in the long run? Image: Goldman Sachs Global Investment Research
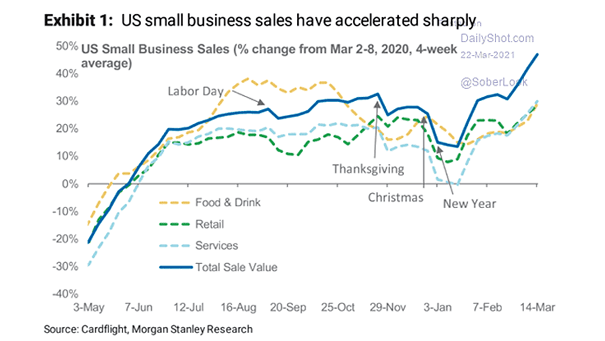
U.S. Small Business Sales U.S. small business sales have accelerated sharply, but how long will this last without more stimulus? Image: Morgan Stanley Research