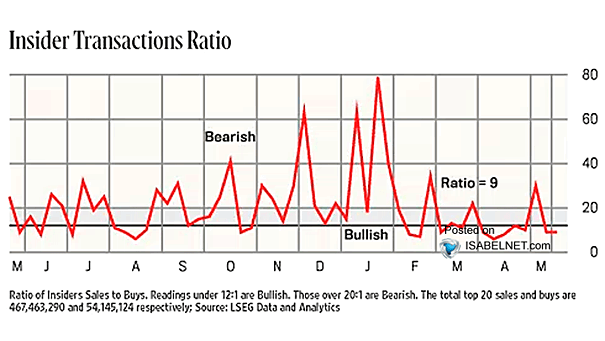
Insider Transactions Ratio
Insider Transactions Ratio Insider activity looks balanced, leaving the Insider Transactions Ratio stuck in neutral. Insiders may be holding back until the market picks a direction. Hard to blame them given the uncertainty. Image: Barron’s