Returns – Bitcoin and Tesla
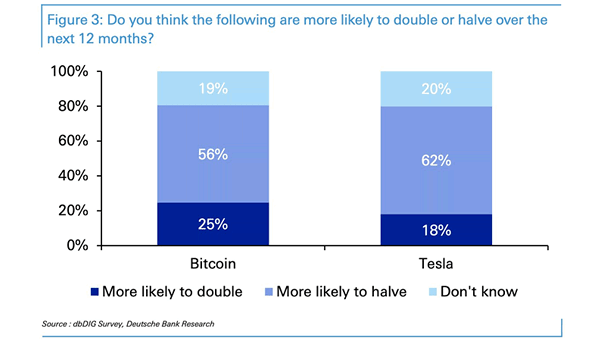
Returns – Bitcoin and Tesla Are Bitcoin and Tesla more likely to halve over the next 12 months? Image: Deutsche Bank Research
Returns – Bitcoin and Tesla Are Bitcoin and Tesla more likely to halve over the next 12 months? Image: Deutsche Bank Research
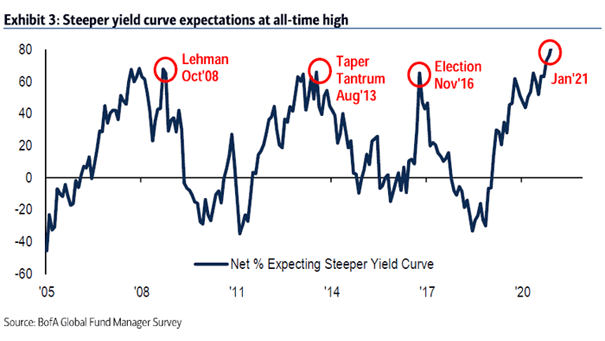
FMS Investors and Yield Curve Expectations 83% of FMS investors expects a steeper yield curve. This is an all-time high. Image: BofA Global Fund Manager Survey

Fed Funds Futures – Interest Rates Will interest rates go up in 2022? Image: TS Lombard
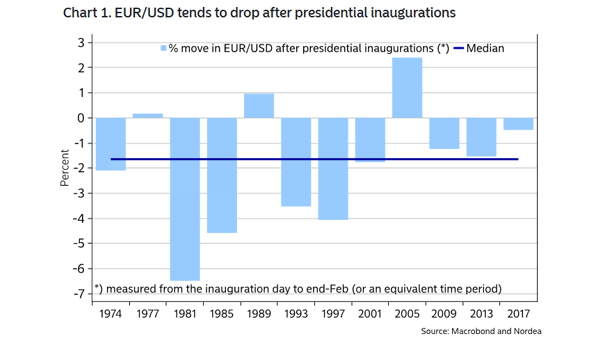
% Move in EUR/USD After U.S. Presidential Inaugurations EUR/USD has tended to decline in the weeks following U.S. presidential inaugurations since 1974. Image: Nordea and Macrobond
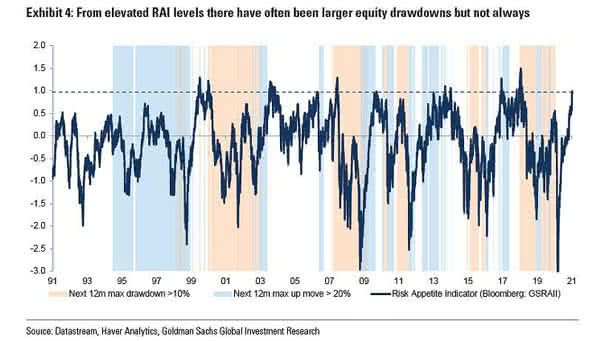
Risk Appetite Indicator Level – Drawdowns and Up Moves Time to reduce risk? When the Risk Appetite Indicator (RAI) level is above 1, near-term returns tend to be lower on average, with larger drawdowns. Image: Goldman Sachs Global Investment Research
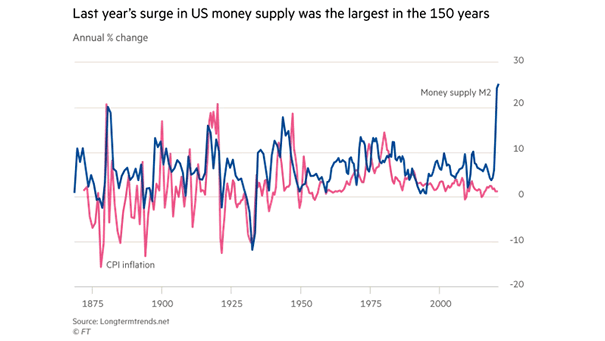
U.S. Money Supply M2 and CPI Inflation The increase in the money supply (M2) tends to lead to higher inflation. Image: Financial Times
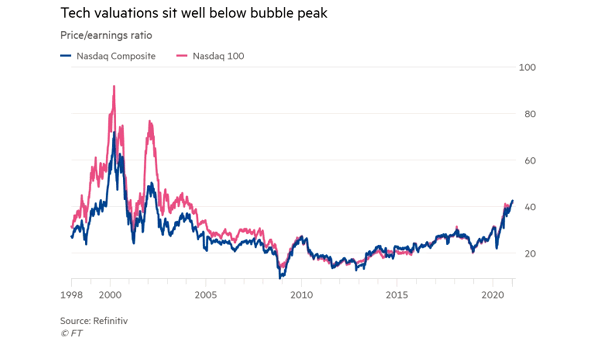
Tech Valuations Should investors be worried about tech valuations? Image: Financial Times
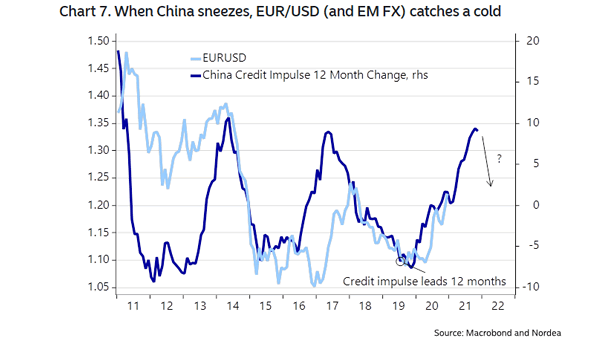
Euro to U.S. Dollar (EUR/USD) and China’s Credit Impulse (Leading Indicator) China’s credit impulse tends to lead the EUR/USD by 12 months. Image: Nordea and Macrobond
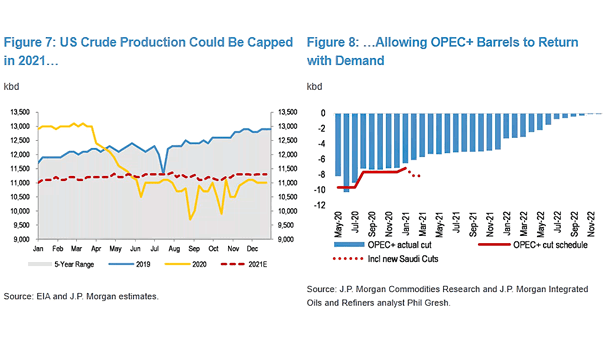
U.S. Crude Oil Production Will oil price bounce back in 2021? Image: J.P. Morgan
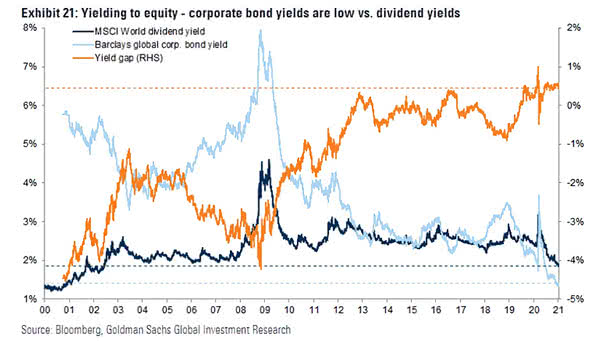
Corporate Bond Yields vs. Dividend Yields Corporate bond yields are low compared to equity dividend yields. Image: Goldman Sachs Global Investment Research
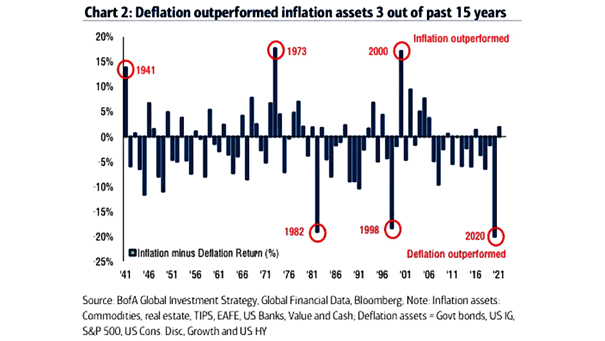
Deflation Assets and Inflation Assets Deflation assets outperformed inflation assets 3 out of past 15 years. Image: BofA Global Investment Strategy