U.S. GDP Forecasts (2020/2023)
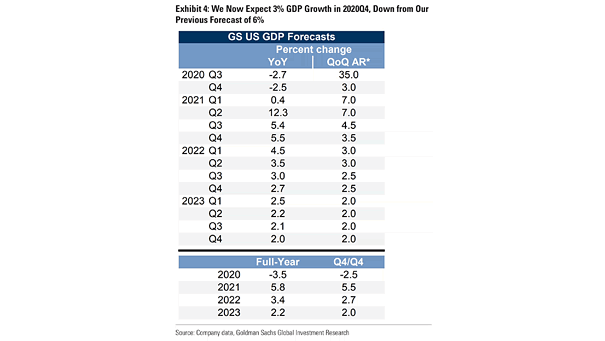
U.S. GDP Forecasts (2020/2023) Goldman Sachs is lowering its Q4 GDP growth forecast from 6% to 3% QoQ, on the lack of further fiscal support. Image: Goldman Sachs Global Investment Research
U.S. GDP Forecasts (2020/2023) Goldman Sachs is lowering its Q4 GDP growth forecast from 6% to 3% QoQ, on the lack of further fiscal support. Image: Goldman Sachs Global Investment Research
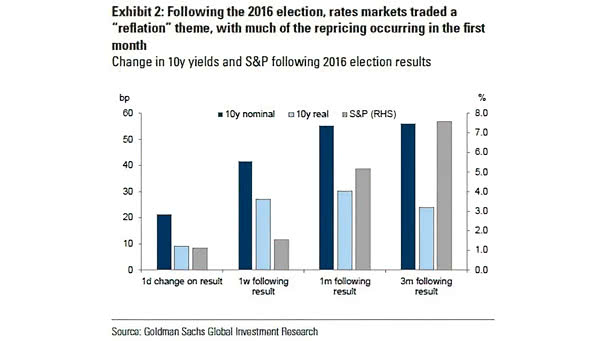
Change in U.S. 10-Year Treasury Yields and S&P 500 Following 2016 Election Results Goldman Sachs expects U.S. 10-year Treasury yields to increase under unified Democratic control of government, reflecting the possibility of a substantial increase in government spending. Image: Goldman Sachs Global Investment Research

S&P 500 Cap-Weighted Index vs. S&P 500 Equally-Weighted Index The current gap between the equal- and cap-weighted indexes has generally ended with the underperformance of mega-cap stocks. Image: Gavekal, Macrobond
Asset Return Expections on a Five-Year Horizon Government bond returns are expected to be negative across developed markets on a five-year horizon. Source: BlackRock Investment Institute
Trend-Following Performance Will trend-following strategies be able to deliver better performance in the future? Image: Financial Times
Different Inflation Buckets Chart suggesting how inflation affects the P/E ratio. Image: Deutsche Bank
World Trade Volume Index World trade is rebounding faster than it did after the financial crisis of 2008. Image: The Wall Street Journal
Valuation – MSCI ACWI and STOXX Europe 600 – 24-Month Forward P/E Percentile vs. History Should investors pay attention to stock valuation? Image: Goldman Sachs Global Investment Research
U.S. Housing – Existing Home Sales Median Price Existing home sales reached their highest level in 14 years, thanks to low rates. Image: Piper Sandler
Russell 1000 American Stock Index – Growth vs. Value The gap between growth and value has widened considerably. It is now the largest divergence in decades. Image: The Economist
Buybacks and S&P 500 Returns Chart suggesting that there is no evidence that buybacks blackouts represent a risk to markets. Image: BofA Securities