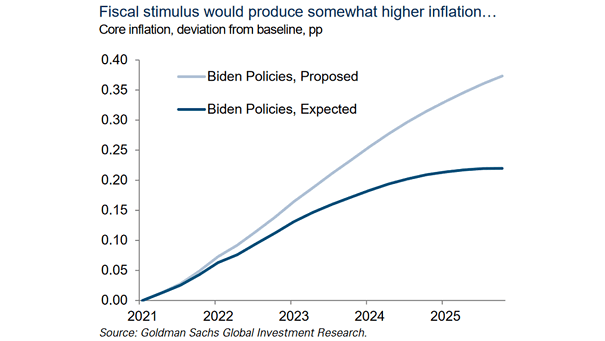
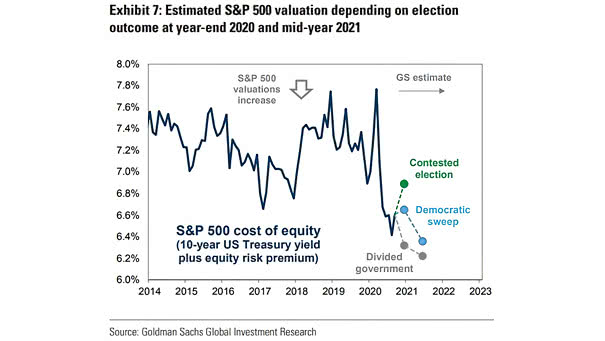
Nasdaq Volatility

Nasdaq Volatility As the chart shows, the volatility of the Nasdaq has been particulary high. Image: Goldman Sachs Global Investment Research

S&P 500 EPS vs. U.S. NIPA Corporate Profits

S&P 500 EPS vs. U.S. NIPA Corporate Profits This chart puts into perspective the wide divergence between S&P 500 EPS and U.S. NIPA corporate profits. Image: BofA Research Investment Committee

Long-Term Bullish S&P 500 View

Long-Term Bullish S&P 500 View A view of sector rotation suggests a long-term bullish trend for the S&P 500. Image: BofA Global Research

S&P 500 Equally-Weighted / S&P 500

S&P 500 Equally-Weighted / S&P 500 Will the S&P Equal Weight Index outperform the S&P 500 Index in the recovery phase? Image: Morgan Stanley Research

Bubble – Wilshire 5000 to Nominal GDP Ratio

Bubble – Wilshire 5000 to Nominal GDP Ratio The ratio of market capitalization to GDP is now higher than it was before the Internet bubble burst. Is the U.S. stock market on a bubble? Image: Statista

SPACs Global Proceeds and S&P 500 Price

SPACs Global Proceeds and S&P 500 Price SPACs (Special Purpose Acquisition Companies) are booming and have coincided with the equity market near highs, according to Citi. Image: CNBC