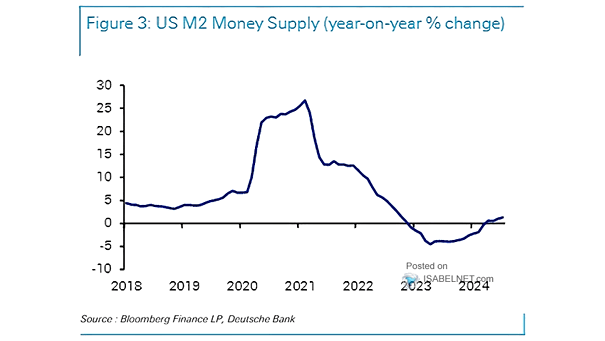
Valuation – Shiller CAPE Ratio for the S&P 500

Valuation – Shiller CAPE Ratio for the S&P 500 The Shiller CAPE has pushed above 40, approaching the 44-times peak seen at the height of the dot-com frenzy. Such rich valuations have often signaled markets running hot. Image: Deutsche Bank Research

Gold vs. 1970s

Gold vs. 1970s Gold has been shining bright, but it’s nowhere near the late-1970s gold rush. Investors might want to keep an open mind. Image: Bloomberg

Seasonality – S&P 500 Index Returns in December

Seasonality – S&P 500 Index Returns in December As the holidays approach, buyers usually return and the year-end rally tends to pick up speed in the second half of December. Historically, U.S. stocks have climbed an average of 1.4% during the month. Image: Carson Investment Research

Index Performance – S&P 500, Nasdaq 100, Russell 2000, Mag 7

Index Performance – S&P 500, Nasdaq 100, Russell 2000, Mag 7 The broad market is quietly rotating: the S&P 500 is just below its October highs, but small caps and the average stock are outperforming, while mega-cap growth and Tech soften. Image: Deutsche Bank Asset Allocation

S&P 500 Valuation Multiples

S&P 500 Valuation Multiples With valuations lofty and expectations running high, U.S. stocks look exposed if earnings or the economy disappoint. Image: Real Investment Advice

S&P 500 and U.S. IPO Activity

S&P 500 and U.S. IPO Activity The IPO market is showing signs of life. A pickup in U.S. listings, paired with improving sentiment in global equities, points to a more bullish medium-term outlook for new issues. Image: Topdown Charts

Margin Debt Balances – YoY % Change

Margin Debt Balances – YoY % Change Margin debt on the NYSE has surged past $1.1 trillion, up nearly 40% YoY, marking one of the fastest spikes on record. Such rapid increases in borrowing, outpacing overall market gains, have often preceded market peaks. Image: Real Investment Advice

S&P 500 Returns After Fed Cuts Within 2% of an All-Time High

S&P 500 Returns After Fed Cuts Within 2% of an All-Time High Bears are losing ground as history leans bullish. Since 1980, when the Fed has eased policy while the S&P 500 traded within 2% of an all‑time high, the index has risen every time in the next 12 months, averaging a 14.2% gain Image:…

S&P 500 vs. U.S. 10-Year Treasury Yield

S&P 500 vs. 10-Year U.S. Treasury Yield The S&P 500 has diverged from bonds in December, largely ignoring the bond market selloff despite 10-year Treasury yields rising notably this month. Stocks seem more focused on solid earnings and the upbeat tone in tech than on rising rates. Image: Bloomberg

U.S. Household Equity Ownership vs. S&P 500 Index

U.S. Household Equity Ownership vs. S&P 500 Index U.S. households have never been this heavily invested in stocks. The higher the concentration, the greater the risk that a market pullback hits both confidence and consumption, reversing wealth effects. Image: Real Investment Advice

S&P 500 Returns After Seven Month Win Streaks

S&P 500 Returns After Seven Month Win Streaks Seven winning months in a row? Since 1950, the S&P 500 has pulled that off 16 times and history says momentum like this rarely cools: nine out of ten times, the rally kept rolling over the next 6 months, posting an average 7% gain. Image: Carson Investment…